Using Filters and Analytics to Understand Your data
In this tutorial, you will learn how to utilize Filters and Analytics within Cleanlab Studio to understand your data so that you can fix issues in the dataset and the processes responsible for introducing these data issues.
This tutorial uses an E-Commerce dataset with images of boots, sandals, and shoes. Download it here. While we use image data as an example here, the steps in this tutorial can be applied to text and structured/tabular datasets as well.
To get started, upload your dataset to Cleanlab Studio. Then create a Project, which is an automated Cleanlab analysis of your dataset that includes suggested corrections to improve the dataset. For help with these steps, check out the Web Quickstart guide.
Overview
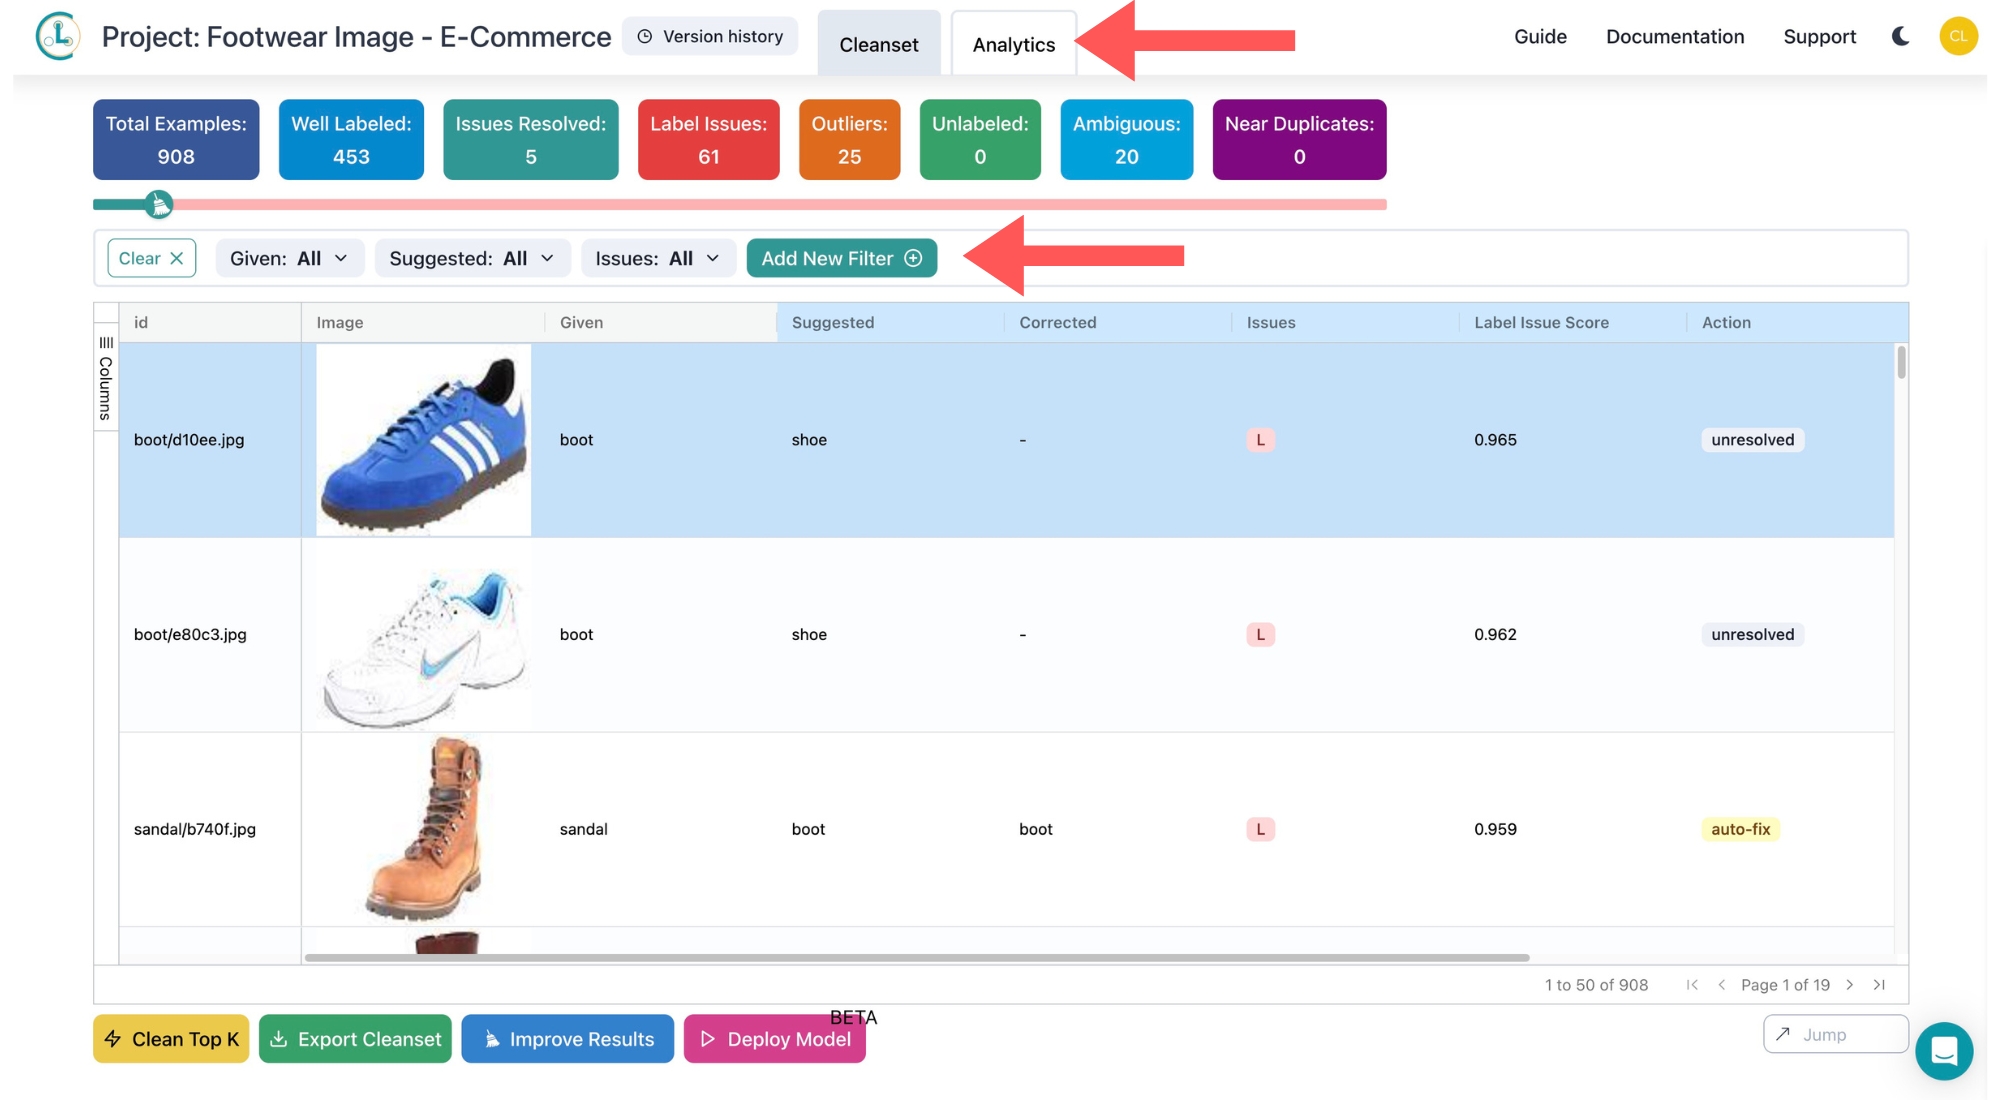
Inside of your Project you will find the Filter bar above the dataset and the Analytics tab at the top of the page.
The Analytics page provides you with visual representations of your dataset in the form of clickable graphs and charts while the Filter tab enables you to display subsets of your data by filtering by values in each of the columns. You can use them in combination to learn about your dataset.
Here’s the recommended workflow:
- Use the Analytics tab to gain a deeper understanding of your data and the issues within. You may find useful insights such as a specific class that is commonly mistaken for another.
- Using this knowledge, focus your attention on specific subsets of the data using the Filters. This allows you to work on correcting similar errors which produces faster and more accurate corrections as you’re not context-switching between different classes and issues.
Using the Analytics Page
To get started, click Analytics at the top of the page.
Each of the graphics includes a detailed explanation on what they are representing. Let’s take a closer look at the Most Frequently Suggested Label Corrections graph which breaks down the different types of potential label errors in your dataset. Each row shows the number of examples which have a Given Label in your dataset that Cleanlab Studio believes should be corrected to the Suggested Label.
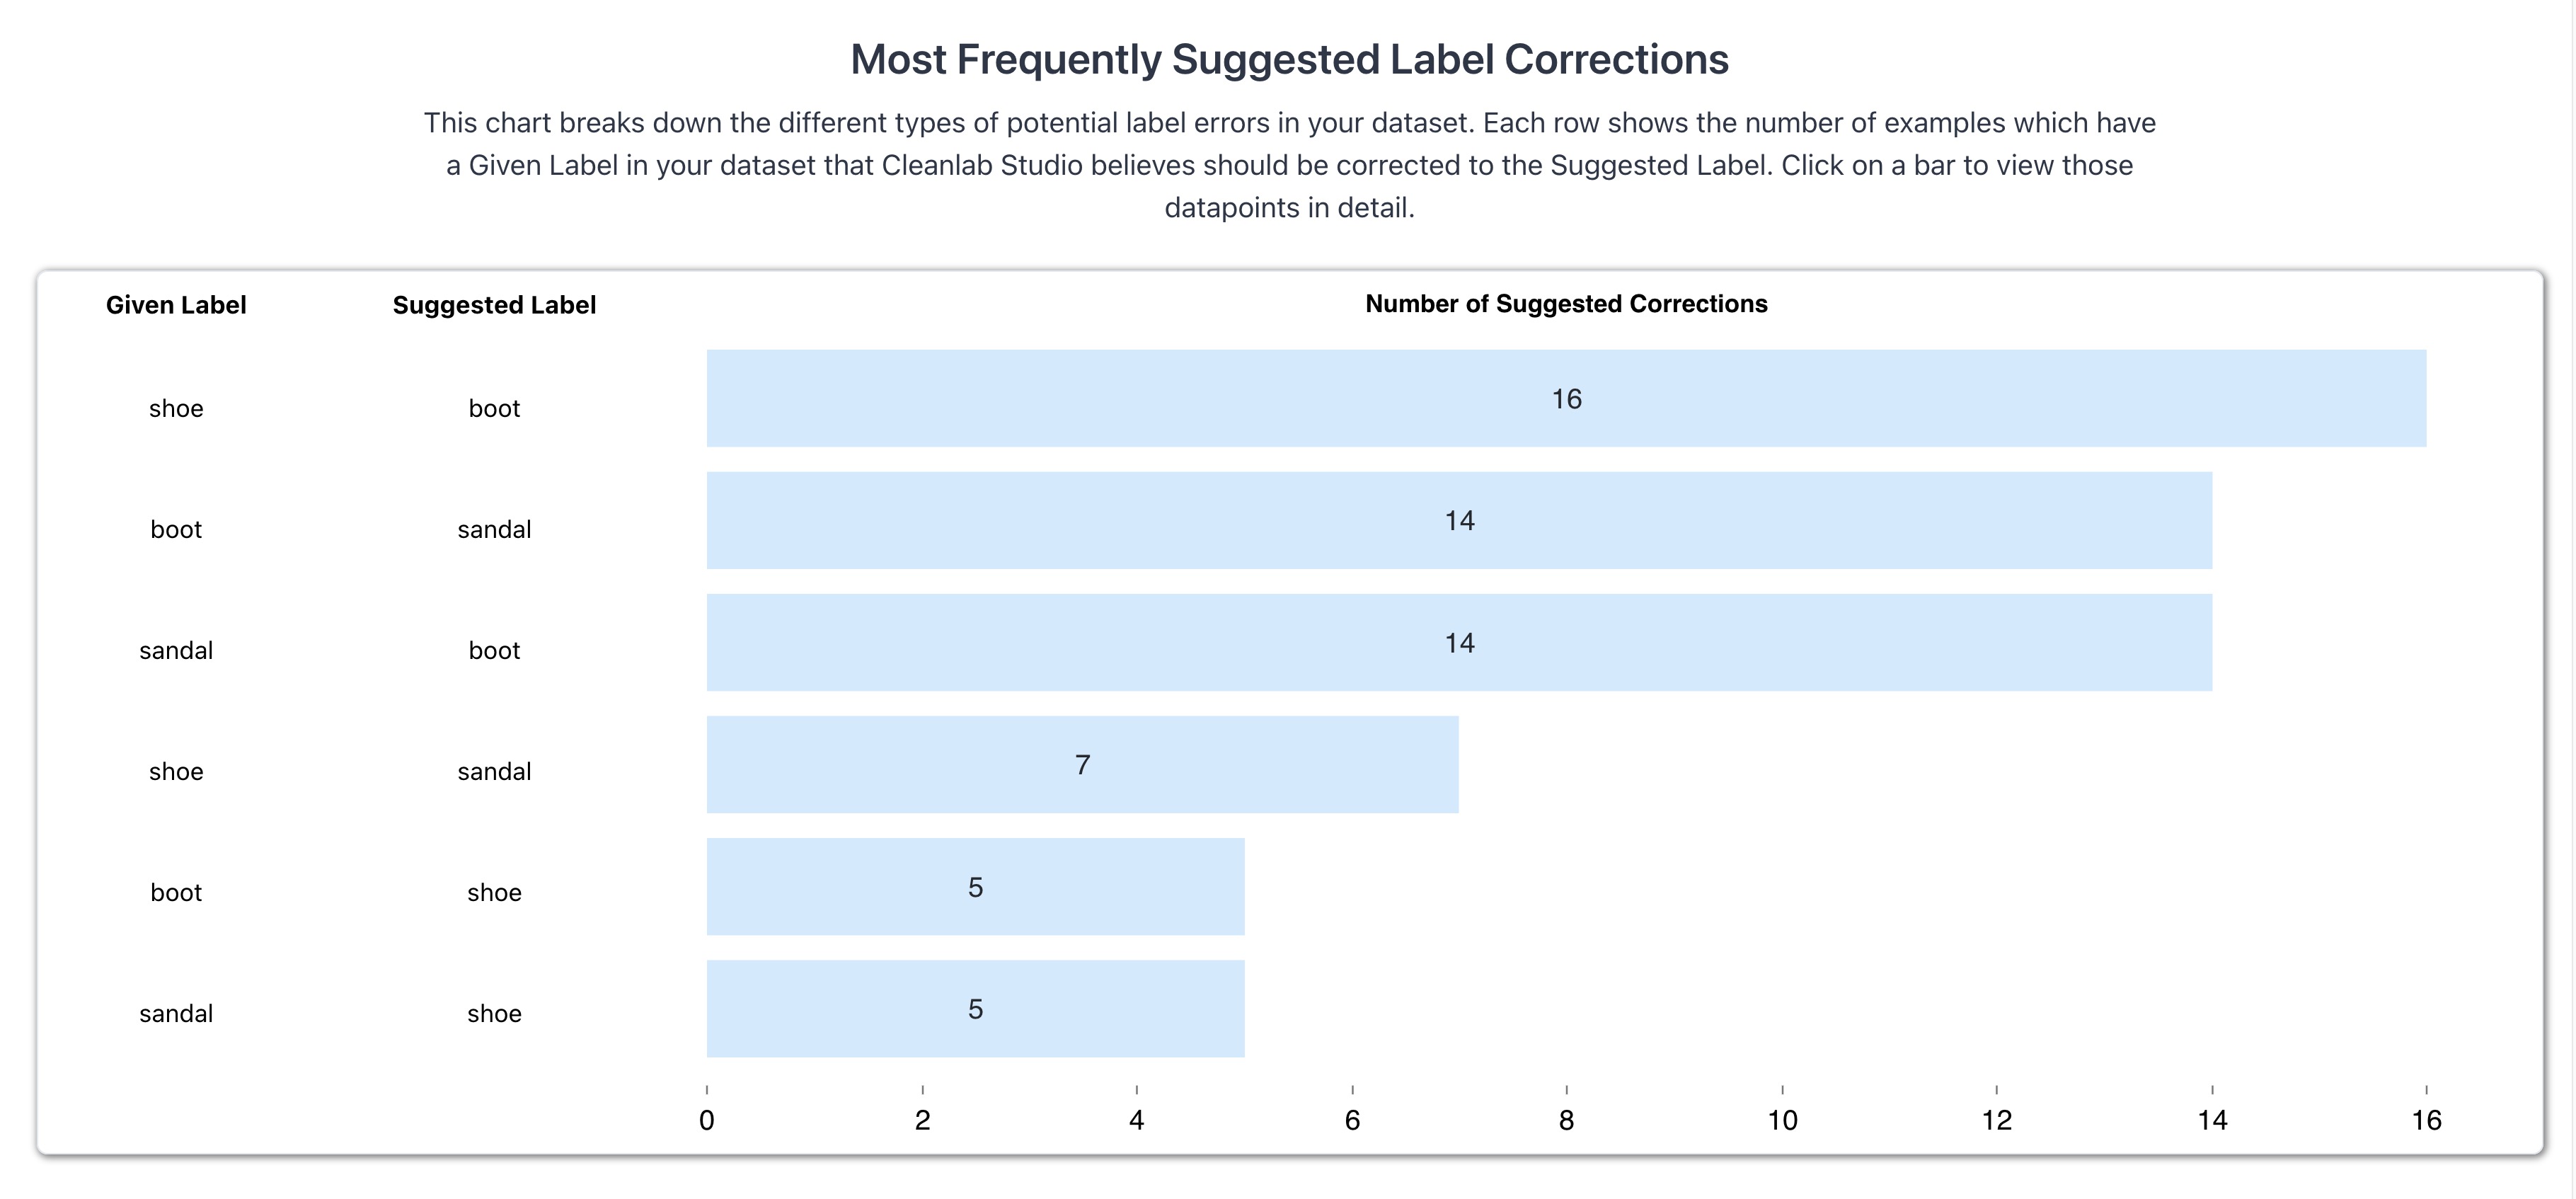
This graph is a great place to understand the relationship of label errors between classes. You can see above that the most common suggested correction is images labeled as shoe but should actually be boot, with 16 data points. This means that your dataset has many images of boots that are improperly labeled as shoes.
Now that you know a bunch of the shoe->boot errors exist, simply click on the bar in the chart to automatically filter your dataset to display those specific errors.
Note: This produces the same results as setting the Given filter to shoe and the Suggested filter to boot.
You can now focus your attention on correcting issues which you know are highly prevalent in your dataset. For the majority of corrections you make on this subset of the data, you will only have to answer the question “Is this a boot or a shoe?” and not “Is this a boot, shoe, or sandal?“. For this dataset with only 3 classes, this might not be a huge time-saver, but for a dataset with 10+ classes you can easily imagine the efficiency gained by narrowing down the choices per correction.
You have the ability to click any bar or chart on the analytics page to view the individual data points that are exhibiting the issue being summarized.
Using the Filters Tab
Although the Analytics page enables you to filter the data in meaningful ways by clicking in certain bars, you may also want to set more complex filters to view custom subsets of the data (perhaps to correct a subset all at once). By default, on the Filter bar you can filter the data based on their Given or Suggested label, as well as which data are detected to exhibit which Issues. If you want to set an additional filter (or multiple) click Add New Filter and select the desired filter.
Imagine you wanted to see all of the images of shoes that have been mislabeled with a high confidence (> 0.7). This translates to a filter with the following settings:
Suggested: shoeIssues: label issueLabel Issue Score,Greater than: 0.7
If you want to clear a single filter, click the filter and select Clear. If you want to clear all of the filters, just click Clear on the left hand side of the Filter bar.
Next Steps
Now that you have a more thorough understanding of your data and know how to view specific subsets, its now time to make the corrections and improve your dataset! If you are uncertain how to do so, take a look at our how to correct issues in our quickstart guide.