Detecting Issues in Regression Datasets (Erroneous Values in Numerical Data)

This tutorial demonstrates how to use Cleanlab Studio’s Python API to analyze a regression dataset. In regression, the dataset labels correspond to a target (aka. outcome/dependent) variable and take continuous/numeric values (i.e. price, income, age) rather than discrete categories (for a similar tutorial on data with categorical labels, check out the Tabular Quickstart).
Cleanlab Studio supports both text and tabular regression datasets. In this tutorial, we’ll look at a tabular dataset where labels are students’ final grades in a course (which may have data entry errors). This tutorial can be generally used to detect erroneous values in any numeric column of a dataset.
Note: regression is currently only supported in the Python API in the generally-available version of Cleanlab Studio. If you require an interactive interface to improve your dataset, please contact us to discuss your use case.
Install and import dependencies
%pip install -U cleanlab-studio
import numpy as np
import pandas as pd
from cleanlab_studio import Studio

from IPython.display import display

pd.set_option("display.max_colwidth", None)
Prepare and Upload Dataset
Our dataset for this tutorial is a collection of student grades and other information about each student. Suppose we are interested in detecting incorrect values (data entry errors) in students’ final_score, which ranges from 0 to 100. In machine learning terminology, this can be considered a regression dataset, where the final_score column is the label for each row (student) in the table.
Load Dataset into Pandas DataFrame
We’ll load the dataset into a Pandas DataFrame from a CSV file hosted in S3. The CSV file contains the following columns:
stud_ID,exam_1,exam_2,exam_3,notes,final_score
0,72,81,80,,73.3
1,89,62,93,,83.8
2,80,76,96,missed class frequently -10,78.6
<id of student>,<grade on exam 1>,<grade on exam 2>,<grade on exam 3>,<optional notes>,<overall letter grade for student>
...
You can similarly format any other tabular or text dataset and run the rest of this tutorial. Details on how to format your dataset can be found in this guide, which also outlines other format options. Cleanlab Studio works out-of-the-box for messy tabular datasets with arbitrary numeric/string columns that may contain missing values.
dataset_url = "https://cleanlab-public.s3.amazonaws.com/StudioDemoDatasets/student_grades_regression.csv"
df = pd.read_csv(dataset_url)
display(df.head(3))
| stud_ID | exam_1 | exam_2 | exam_3 | notes | final_score | |
|---|---|---|---|---|---|---|
| 0 | 0 | 72 | 81 | 80 | NaN | 73.3 |
| 1 | 1 | 89 | 62 | 93 | NaN | 83.8 |
| 2 | 2 | 97 | 0 | 94 | NaN | 73.5 |
Upload Dataset to Cleanlab Studio
Use your API key to instantiate a Studio object, which can be used to analyze your dataset.
# you can find your API key by going to app.cleanlab.ai/upload,
# clicking "Upload via Python API", and copying the API key there
API_KEY = "<insert your API key>"

# authenticate with your API key
studio = Studio(API_KEY)
Next load the dataset into Cleanlab Studio (more details/options can be found in this guide). This may take a while for big datasets. We explicitly set the type for the final_score column to float here, since the label column must have type float for a regression project (otherwise specifying schemas is optional). See this guide for more information on schema overrides.
dataset_id = studio.upload_dataset(
    df,
    dataset_name="Student Grades (regression)",
    schema_overrides=[{"name": "final_score", "column_type": "float"}],
)
Launch a Project
Let’s now create a project using this dataset. A Cleanlab Studio project will automatically train ML models to provide AI-based analysis of your dataset.
Note: By default Cleanlab Studio uses all columns provided as predictive features except the label column. Since our dataset contains a stud_ID column which is not a predictive feature of the output score, we explicitly specify the feature columns as well as the name of the label column, i.e. final_score column in the dataset.
project_id = studio.create_project(
    dataset_id=dataset_id,
    project_name="Student Grades (regression) Project",
    modality="tabular",
    task_type="regression",
    model_type="regular",
    label_column="final_score",
    feature_columns=["exam_1", "exam_2", "exam_3", "notes"],
)
print(f"Project successfully created and training has begun! project_id: {project_id}")
Above, we specified modality="tabular" because this tutorial uses a tabular dataset; you can specify modality="text" if you’re using a text dataset. See the documentation for create_project for the full set of options.
Once the project has been launched successfully and you see your project_id, feel free to close this notebook. It will take some time for Cleanlab’s AI to train on your data and analyze it. Come back after training is complete (you will receive an email) and continue with the notebook to review your results.
You should only execute the above cell once per dataset. After launching the project, you can poll for its status to programmatically wait until the results are ready for review. Each project creates a cleanset, an improved version of your original dataset that contains additional metadata for helping you clean up the data. The next code cell simply waits until this cleanset has been created.
Warning! For big datasets, this next cell may take a long time to execute while Cleanlab’s AI model is training. If your notebook has timed out during this process, you can resume work by re-running the below cell (which should return the cleanset_id instantly if the project has completed training). Do not re-run the above cell and create a new project.
cleanset_id = studio.get_latest_cleanset_id(project_id)
print(f"cleanset_id: {cleanset_id}")
project_status = studio.wait_until_cleanset_ready(cleanset_id)
Once the above cell completes execution, your project results are ready for review!
Download Cleanlab columns
We can fetch the Cleanlab columns that contain the metadata of this cleanset using its cleanset_id. These columns have the same length as your original dataset and provide metadata about each individual data point, like what types of issues it exhibits and how severe these issues are.
If at any point you want to re-run the remaining parts of this notebook (without creating another project), simply call studio.download_cleanlab_columns(cleanset_id) with the cleanset_id printed from the previous cell.
cleanlab_columns_df = studio.download_cleanlab_columns(cleanset_id)
cleanlab_columns_df.head()
| cleanlab_row_ID | corrected_label | is_label_issue | label_issue_score | suggested_label | is_near_duplicate | near_duplicate_score | near_duplicate_cluster_id | is_outlier | outlier_score | is_initially_unlabeled | |
|---|---|---|---|---|---|---|---|---|---|---|---|
| 0 | 1 | NaN | False | 0.779405 | NaN | True | 0.952681 | 0 | False | 0.000522 | False |
| 1 | 2 | NaN | False | 0.640746 | NaN | False | 0.553077 | <NA> | False | 0.000351 | False |
| 2 | 3 | NaN | True | 0.985484 | 62.87463 | False | 0.578622 | <NA> | False | 0.000766 | False |
| 3 | 4 | NaN | False | 0.681494 | NaN | False | 0.628423 | <NA> | False | 0.000755 | False |
| 4 | 5 | NaN | False | 0.662657 | NaN | False | 0.521975 | <NA> | False | 0.000884 | False |
Review detected data issues
Optional: Initialize helper methods to better visualize numeric and string columns based on colored values (click to expand)
Coloring helps us clearly understand data entry errors for this particular tutorial dataset, but is optional for your own datasets.
from typing import Callable, Dict, Optional
from IPython.core.display import HTML
import matplotlib.colors


def color_calc(value: float):
    """
    Calculate color based on the given value. Intended for the range of 0 to 100. No error checking is done.

    Parameters:
    value (int or float): Value based on which the color is determined.

    Returns:
    str: Hexadecimal color code.
    """
    if value <= 50:
        r = 1.0
        g = (value / 50) * 194.0 / 255.0 + 61.0 / 255.0
        b = 61.0 / 255.0
    else:
        r = (100 - value) / 50
        g = 1.0
        b = 0.0
    hex_color = matplotlib.colors.to_hex((r, g, b))
    return hex_color


def grade_to_color(value: float):
    """
    Format numerical grade value with background color. Intended for the range of 0 to 100. No error checking is done.

    Parameters:
    value (int or float): Numerical grade value.

    Returns:
    str: HTML div string with background color based on grade value.
    """
    hex_color = color_calc(value)
    return (
        f'<div style="background-color: {hex_color}; text-align: center;">{value}</div>'
    )


def highlight_notes(note: str):
    """
    Format notes with background color based on keywords. Notes are returned as is if no keywords are found.

    Parameters:
    note (str): Text of notes.

    Returns:
    str: HTML div string with background color based on keywords found in notes.
    """
    if "missed" in note:
        value = 40
    elif "cheated" in note:
        value = 0
    elif "great participation" in note:
        value = 100
    else:
        return note  # default (no color)

    hex_color = color_calc(value)
    return f'<div style="background-color: {hex_color};">{note}</div>'


_TUTORIAL_FORMATTERS = {
    "exam_1": grade_to_color,
    "exam_2": grade_to_color,
    "exam_3": grade_to_color,
    "given_label": grade_to_color,
    "suggested_label": grade_to_color,
    "notes": highlight_notes,
}


def display(df, formatters: Optional[Dict[str, Callable]] = None):
    """
    Display DataFrame with formatted columns.

    Parameters:
    df (pd.DataFrame): DataFrame to display.

    Returns:
    IPython.core.display.HTML: HTML representation of formatted DataFrame.
    """
    if formatters is None:
        formatters = {}
    return HTML(df.to_html(escape=False, formatters=formatters, index=False))


disable_pretty_print = (
    False  # set to True to disable pretty printing when displaying DataFrames
)

optional_df_display_formatters = None if disable_pretty_print else _TUTORIAL_FORMATTERS
Details about all of the returned Cleanlab columns and their meanings can be found in this guide. In this tutorial, we focus on columns related to label issues, outliers and near duplicates:
- is_label_issue indicates that the original value in the column you chose as the class label appears incorrect for a particular row (perhaps due to data entry error, or accidental mislabeling). For such data, consider correcting this value to the
suggested_labelvalue if it seems more appropriate. - label_issue_score represents the severity of the label issue in each row (on a scale of 0-1 with 1 indicating the most severe instances of the issue).
- is_outlier indicates that a particular row is an outlier in the dataset.
- outlier_score represents the severity of the outlier issue in each row (on a scale of 0-1 with 1 indicating the most severe instances of the issue).
- is_near_duplicate indicates that a particular row is a near(or exact) duplicate of another row in the dataset.
- near_duplicate_score represents the severity of the near duplicate issue in each row (on a scale of 0-1 with 1 indicating the most severe instances of the issue).
Label issues
Let’s take a look at the label quality in our dataset. We first create a given_label column in our DataFrame to clearly indicate the class label originally assigned to each data point in this dataset.
# Combine the dataset with the cleanlab columns
combined_dataset_df = df.merge(cleanlab_columns_df, left_index=True, right_index=True)

# Set a "given_label" column to the original label
combined_dataset_df.rename(columns={"final_score": "given_label"}, inplace=True)

# Store the column names of the dataset for visualization
DATASET_COLUMNS = df.columns.drop("final_score").tolist()
To see which data points are estimated to be mislabeled (i.e. have potentially erroneous values in the class label column), we filter by is_label_issue. We sort by label_issue_score to see which of these data points are most likely mislabeled.
samples_ranked_by_label_issue_score = combined_dataset_df[
    combined_dataset_df["is_label_issue"]
].sort_values("label_issue_score", ascending=False)

columns_to_display = DATASET_COLUMNS + [
    "label_issue_score",
    "is_label_issue",
    "given_label",
    "suggested_label",
]
display(
    samples_ranked_by_label_issue_score.head(5)[columns_to_display],
    formatters=optional_df_display_formatters,
)
| stud_ID | exam_1 | exam_2 | exam_3 | notes | label_issue_score | is_label_issue | given_label | suggested_label |
|---|---|---|---|---|---|---|---|---|
| 659 | 67 |
93 |
93 |
NaN | 1.0 | True | 17.4 |
84.1853179932 |
| 560 | 95 |
0 |
72 |
NaN | 1.0 | True | 0.0 |
53.5097465515 |
| 318 | 41 |
88 |
98 |
missed class frequently -10 |
1.0 | True | 0.0 |
70.3309936523 |
| 160 | 97 |
86 |
54 |
missed homework frequently -10 |
1.0 | True | 0.0 |
61.021068573 |
| 367 | 78 |
0 |
86 |
NaN | 1.0 | True | 0.0 |
55.161655426 |
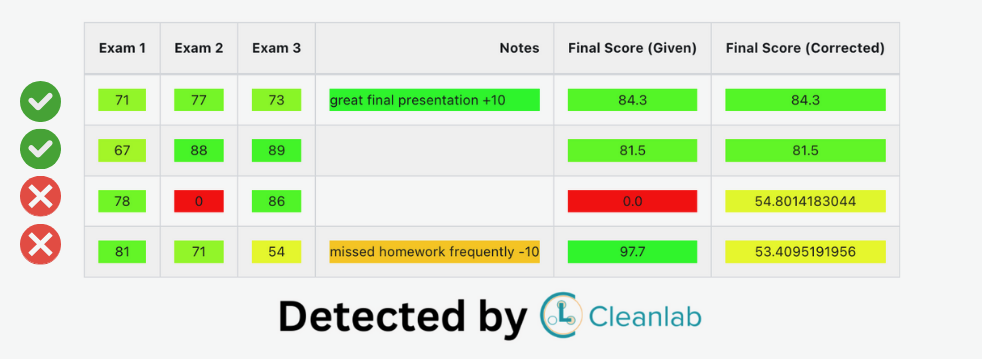
For example, looking at the first row above: the student recieved grades of 67, 93, and 93 on their exams, but ended up with a final grade of 17.4/100, which is certainly a data entry error!
Outliers
Let’s take a look at the outliers detected in the dataset. To view the outliers, we again filter using is_outlier column and sort by outlier_score in descending order to view most likely outliers.
samples_ranked_by_outlier_score = combined_dataset_df[
    combined_dataset_df["is_outlier"]
].sort_values("outlier_score", ascending=False)

columns_to_display = DATASET_COLUMNS + [
    "outlier_score",
    "is_outlier",
    "given_label",
    "suggested_label",
]
display(
    samples_ranked_by_outlier_score.head(5)[columns_to_display],
    formatters=optional_df_display_formatters,
)
| stud_ID | exam_1 | exam_2 | exam_3 | notes | outlier_score | is_outlier | given_label | suggested_label |
|---|---|---|---|---|---|---|---|---|
| 509 | 65 |
85 |
80 |
great participation +10 |
0.168298 | True | 82.2 |
NaN |
| 613 | 93 |
58 |
70 |
great final presentation +10 | 0.166990 | True | 83.8 |
NaN |
| 889 | 75 |
91 |
68 |
great final presentation +10 | 0.166341 | True | 85.7 |
NaN |
| 178 | 90 |
67 |
77 |
missed class frequently -10 |
0.155053 | True | 77.6 |
NaN |
| 570 | 90 |
67 |
77 |
missed class frequently -10 |
0.155053 | True | 71.7 |
NaN |
We can note that the student well or poorly in 2 out of 3 exams, whereas the performance is opposite in the third one. This most likely indicates an outlier issue either related to data entry or evaluation of the exam.
Near Duplicates
For viewing near duplicates in the dataset, we filter the rows using is_near_duplicate column and then sort using near_duplicate_score as well as near_duplicate_cluster_id. The rows that belong to the same set of near duplicates have the same near_duplicate_cluster_id.
samples_ranked_by_near_duplicate_score = combined_dataset_df[
    combined_dataset_df["is_near_duplicate"]
].sort_values(["near_duplicate_score", "near_duplicate_cluster_id"], ascending=False)

columns_to_display = DATASET_COLUMNS + [
    "near_duplicate_score",
    "is_near_duplicate",
    "near_duplicate_cluster_id",
    "given_label",
    "suggested_label",
]
display(
    samples_ranked_by_near_duplicate_score.head(6)[columns_to_display],
    formatters=optional_df_display_formatters,
)
| stud_ID | exam_1 | exam_2 | exam_3 | notes | near_duplicate_score | is_near_duplicate | near_duplicate_cluster_id | given_label | suggested_label |
|---|---|---|---|---|---|---|---|---|---|
| 544 | 78 |
58 |
86 |
great final presentation +10 | 1.0 | True | 23 | 84.4 |
NaN |
| 549 | 78 |
58 |
86 |
great final presentation +10 | 1.0 | True | 23 | 84.3 |
NaN |
| 399 | 86 |
80 |
89 |
NaN | 1.0 | True | 17 | 81.2 |
NaN |
| 953 | 86 |
80 |
89 |
NaN | 1.0 | True | 17 | 82.5 |
NaN |
| 269 | 73 |
80 |
95 |
NaN | 1.0 | True | 11 | 80.7 |
NaN |
| 562 | 73 |
80 |
95 |
NaN | 1.0 | True | 11 | 83.5 |
NaN |
We can clearly note that some rows are duplicated in this dataset, which can affect the performance of model trained on it.
Improve the dataset based on the detected issues
Since the results of this analysis appear reasonable, let’s use the Cleanlab columns to improve the quality of our dataset. For your own datasets, which actions you should take to remedy the detected issues will depend on what you are using the data for. No single action is going to be the best choice across all datasets, so we caution against blindly copying the actions we perform below.
For data marked as label_issue, we create a new corrected_label column, which will be the given label for data without detected label issues, and the suggested_label for data with detected label issues. We are not using the results for outlier and near duplicates issues to improve the dataset, as that requires more careful consideration and domain expertise.
corrected_label = np.where(
    combined_dataset_df["is_label_issue"],
    combined_dataset_df["suggested_label"],
    combined_dataset_df["given_label"],
)
Finally, let’s actually make a new version of our dataset with these changes.
We craft a new DataFrame from the original, applying corrections and exclusions, and then use this DataFrame to save the new dataset in a separate CSV file. The new dataset is a CSV file that looks just like our original dataset — you can use it as a plug-in replacement to get more reliable results in your ML and Analytics pipelines, without any change in your existing modeling code.
new_dataset_filename = "improved_dataset.csv"
# Fetch the original dataset
fixed_dataset = combined_dataset_df[DATASET_COLUMNS].copy()

# Add the corrected label column
fixed_dataset["final_score"] = corrected_label

# Save improved dataset to new CSV file
fixed_dataset.to_csv(new_dataset_filename, index=False)
print(f"Adjusted dataset saved to {new_dataset_filename}")