Detecting Issues in Multi-Label Datasets
In this tutorial, you will prepare and format a multi-label dataset for use in Cleanlab Studio, walk through some of the analyses Cleanlab Studio runs and how they help improve data quality, and finally export your cleaned dataset for downstream use.
In multi-label classification datasets, each data point can simultaneously belong to multiple of K possible classes (or none of them). This is different than multi-class classification, where each data point is assigned to exactly one class. Examples of multi-label classification applications include: listing the objects depicted within an image, tagging a product with multiple attributes, or describing the emotions expressed in a paragraph.
Each label in a multi-label dataset comes with increased potential for annotation errors, and Cleanlab Studio adeptly mitigates those risks. In the popular CelebA image tagging dataset, Cleanlab Studio identified errors in 18% of the images. Learn more in our blogpost.
Preparing your dataset
This tutorial uses the CelebA image tagging dataset. While this tutorial focuses on image data, Cleanlab Studio enables you to do all of the same things demonstrated here for multi-label text or structured/tabular datasets as well.
This tutorial uses the “images with metadata” format for uploading data to Cleanlab Studio, where data is formatted as a ZIP file containing:
- Image folder: collection of images stored in a directory
metadata.csv: file containing filepath and labels for each of the images (requires specific format for multi-label data)
The next few sections will walk through how to transform the Kaggle version of CelebA, specifically the attributes dataset (list_attr_celeba.csv), into the required format using Google Sheets, a spreadsheet editor. Note that this process can be applied to any multi-label dataset by adapting the formatting to your specific data.
If you want to skip ahead, you can download the dataset formatted for Cleanlab Studio here.
Overview
The list_attr_celeba.csv file from Kaggle is structured in a one-hot-encoding format. Each column represents a specific class label (e.g. Smiling, Black_Hair). A value of 1 indicates that the class applies to the given image, while a -1 signifies that it does not. In order for Cleanlab Studio to analyze multi-label data, your class labels must be formatted as a comma-separated list of applicable attributes.
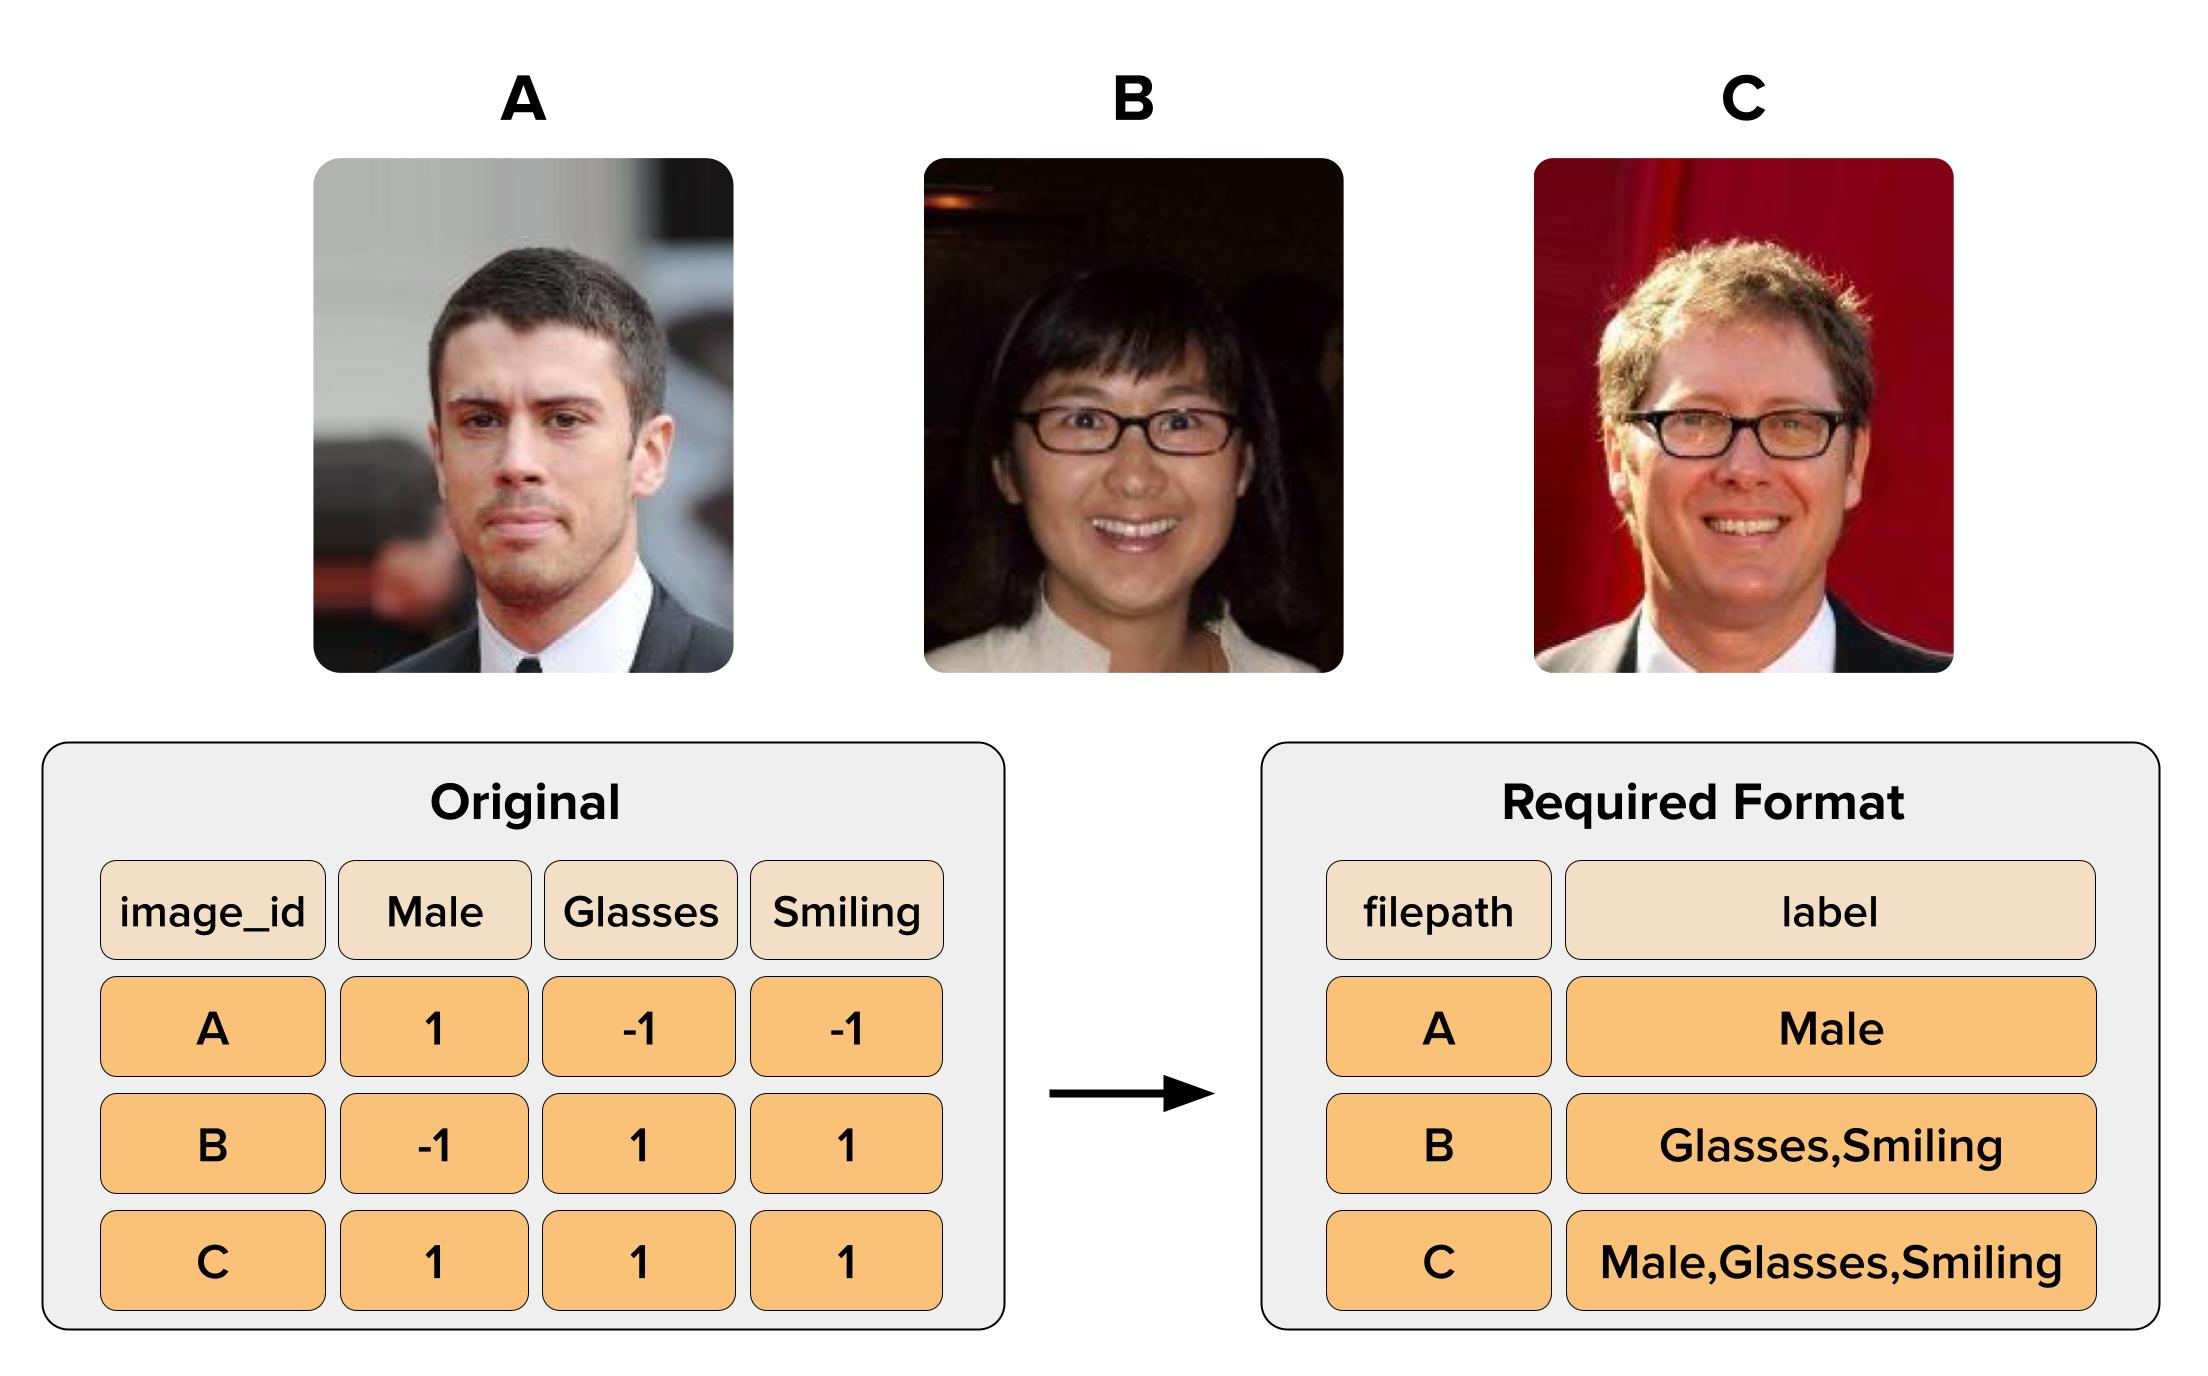
Above is a simplified version of how you are required to reformat this multi-label dataset. In the original dataset on the left, each of the class labels Male, Glasses, Smiling are represented as columns, with 1s and -1s indicating if they apply to the given image. Looking at image C (row 3), all three of the class labels have 1s, which means all three of them apply to the image of the smiling man wearing glasses. To format this properly, combine all of the applicable class labels for each image and separate them with commas (no spaces in between) like this Male,Glasses,Smiling.
Following these steps will transform the original dataset from Kaggle to a format understood by Cleanlab Studio:
- Apply formula to convert from
1s and-1s to list of class labels - Apply formula to add the parent folder name to the
image_idto create a filepath - Remove unnecessary columns
- Export CSV as
metadata.csv - Add
metadata.csvinside of the images folder - Zip the images folder
Convert from one-hot-encoding to list format
You can also use Python instead of Google Sheets to reformat list_attr_celeba.csv in just a few lines (click to expand)
# Read in CSV.
df = pd.read_csv("list_attr_celeba.csv")
# Transform one-hot-encoding into list of attributes.
df['label'] = df.apply(lambda row: ','.join(row.index[row == 1].tolist()), axis=1)
# Select column, rename, and export.
df = df[['image_id', 'label']]
# For metadata ZIP upload, the image column must be named "image"
df = df.rename(columns={"image_id": "image"})
df.to_csv('metadata.csv')
If you use this method, you can skip to here.
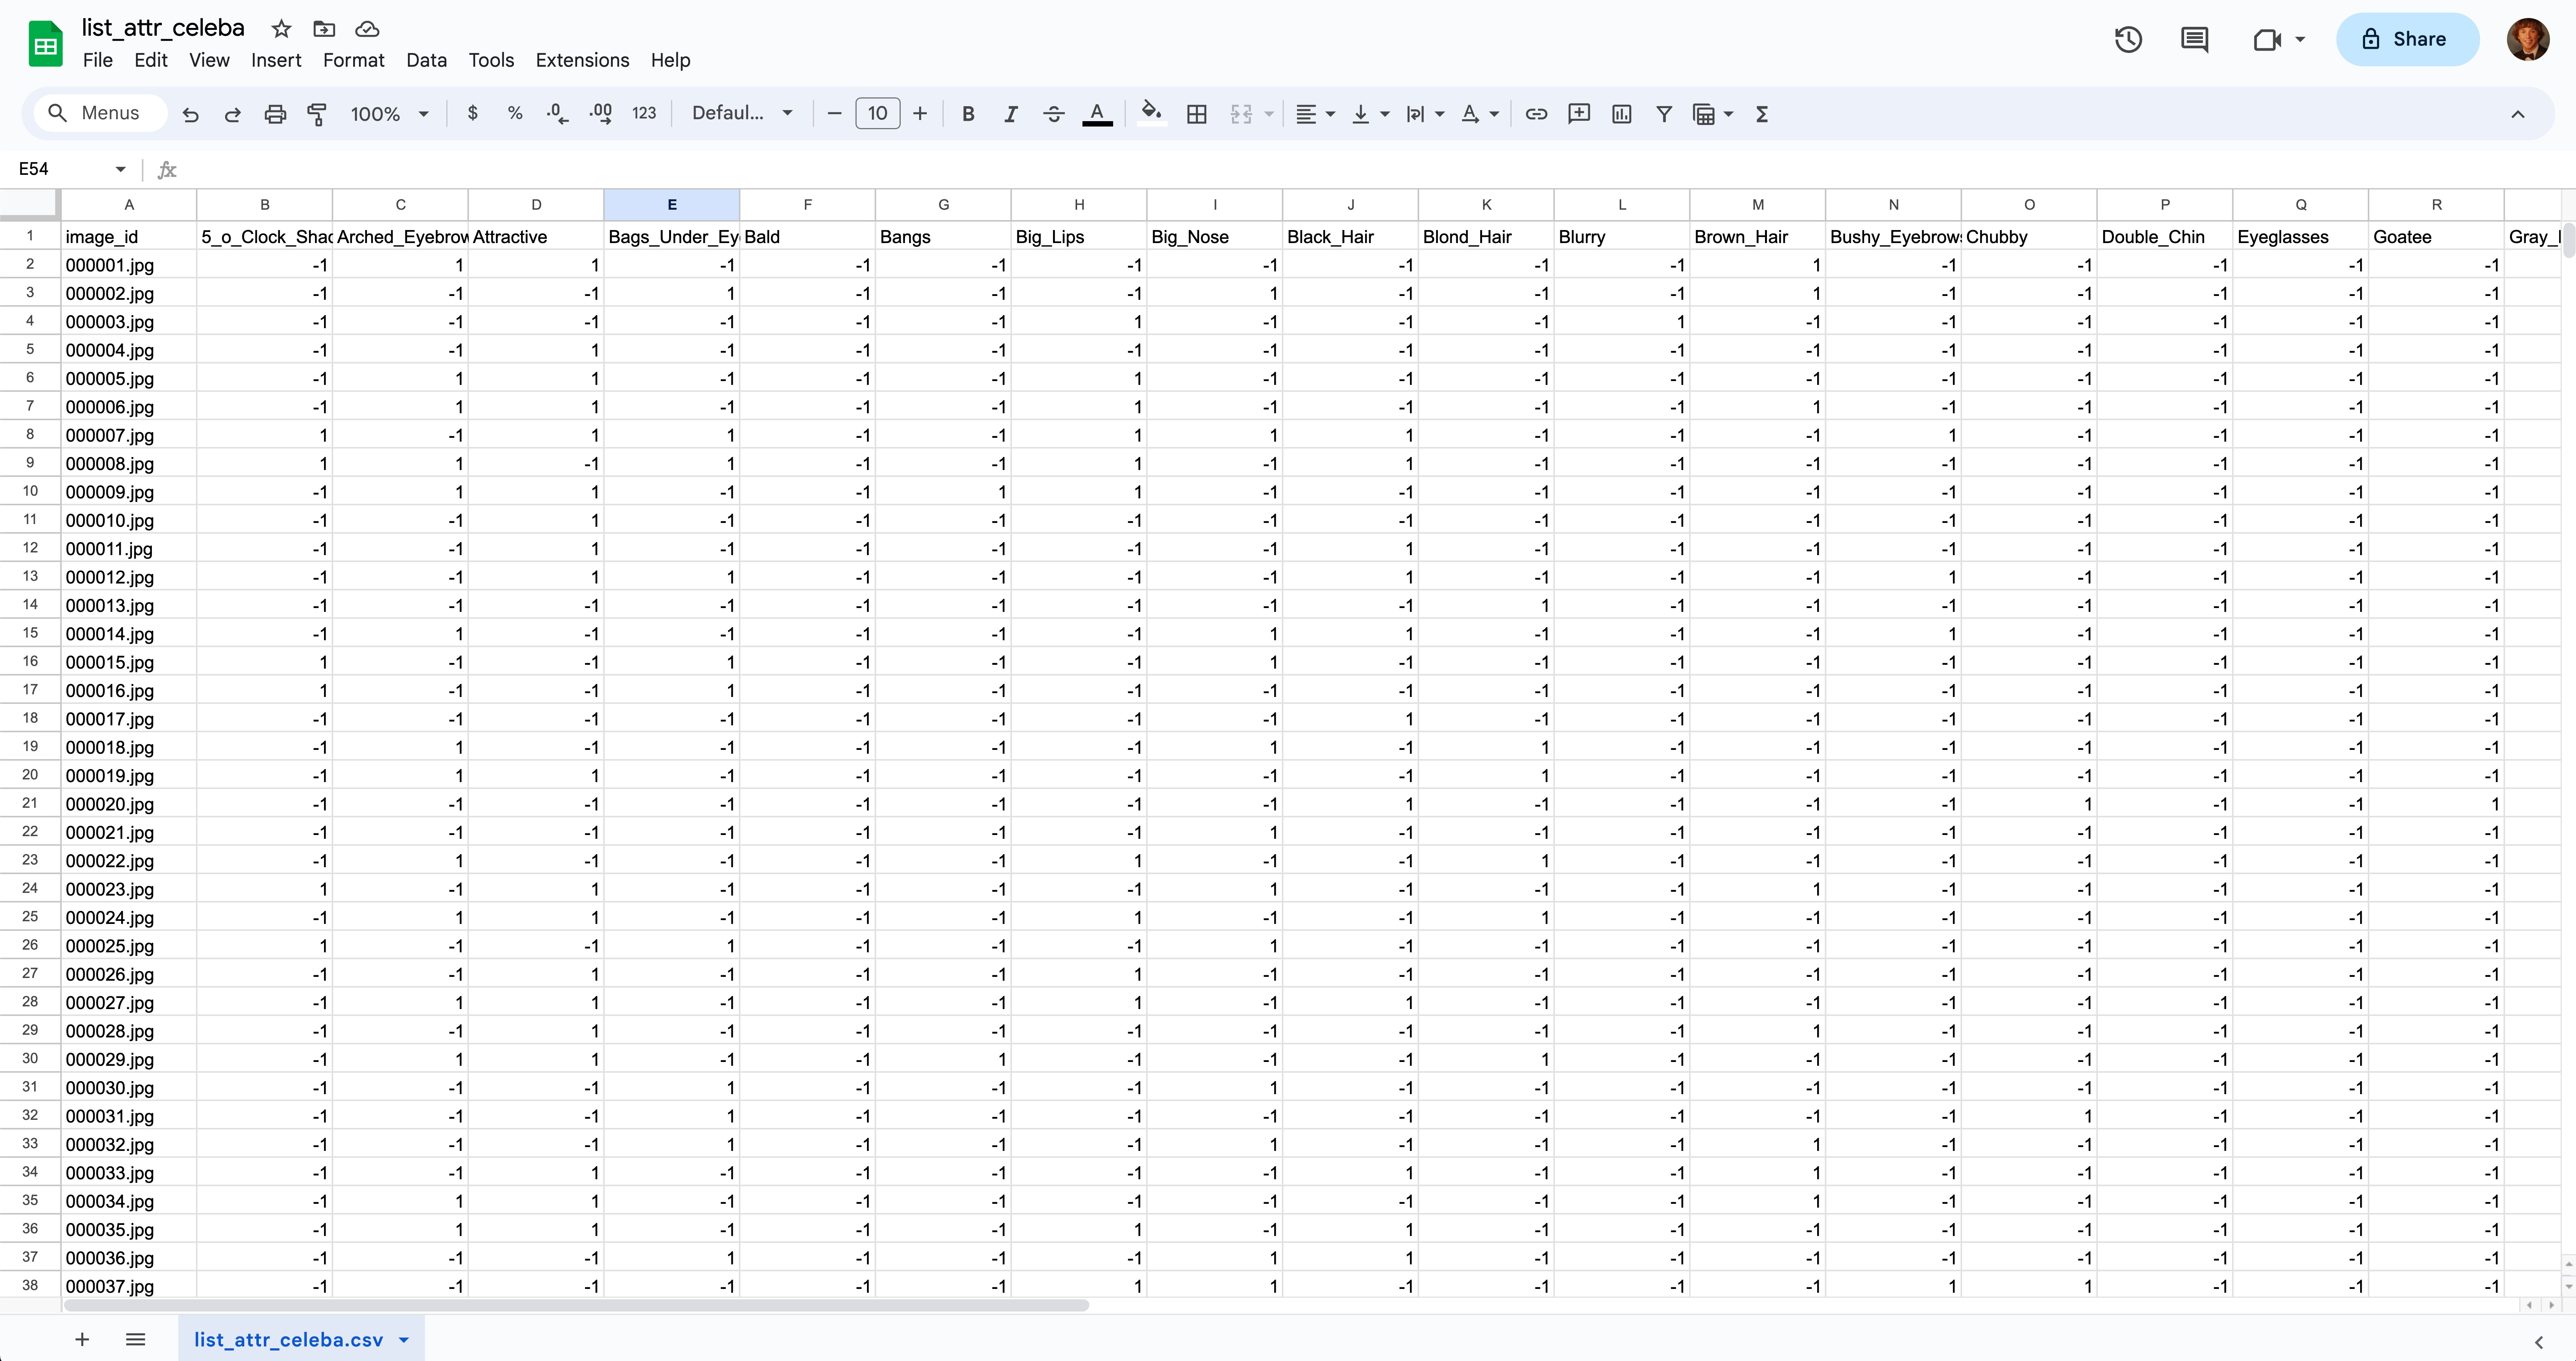
Open up list_attr_celeba.csv in Google Sheets. Column A should contain all of the image_ids, and columns B-AO should have all of the class labels at the top with 1 and -1 values below.
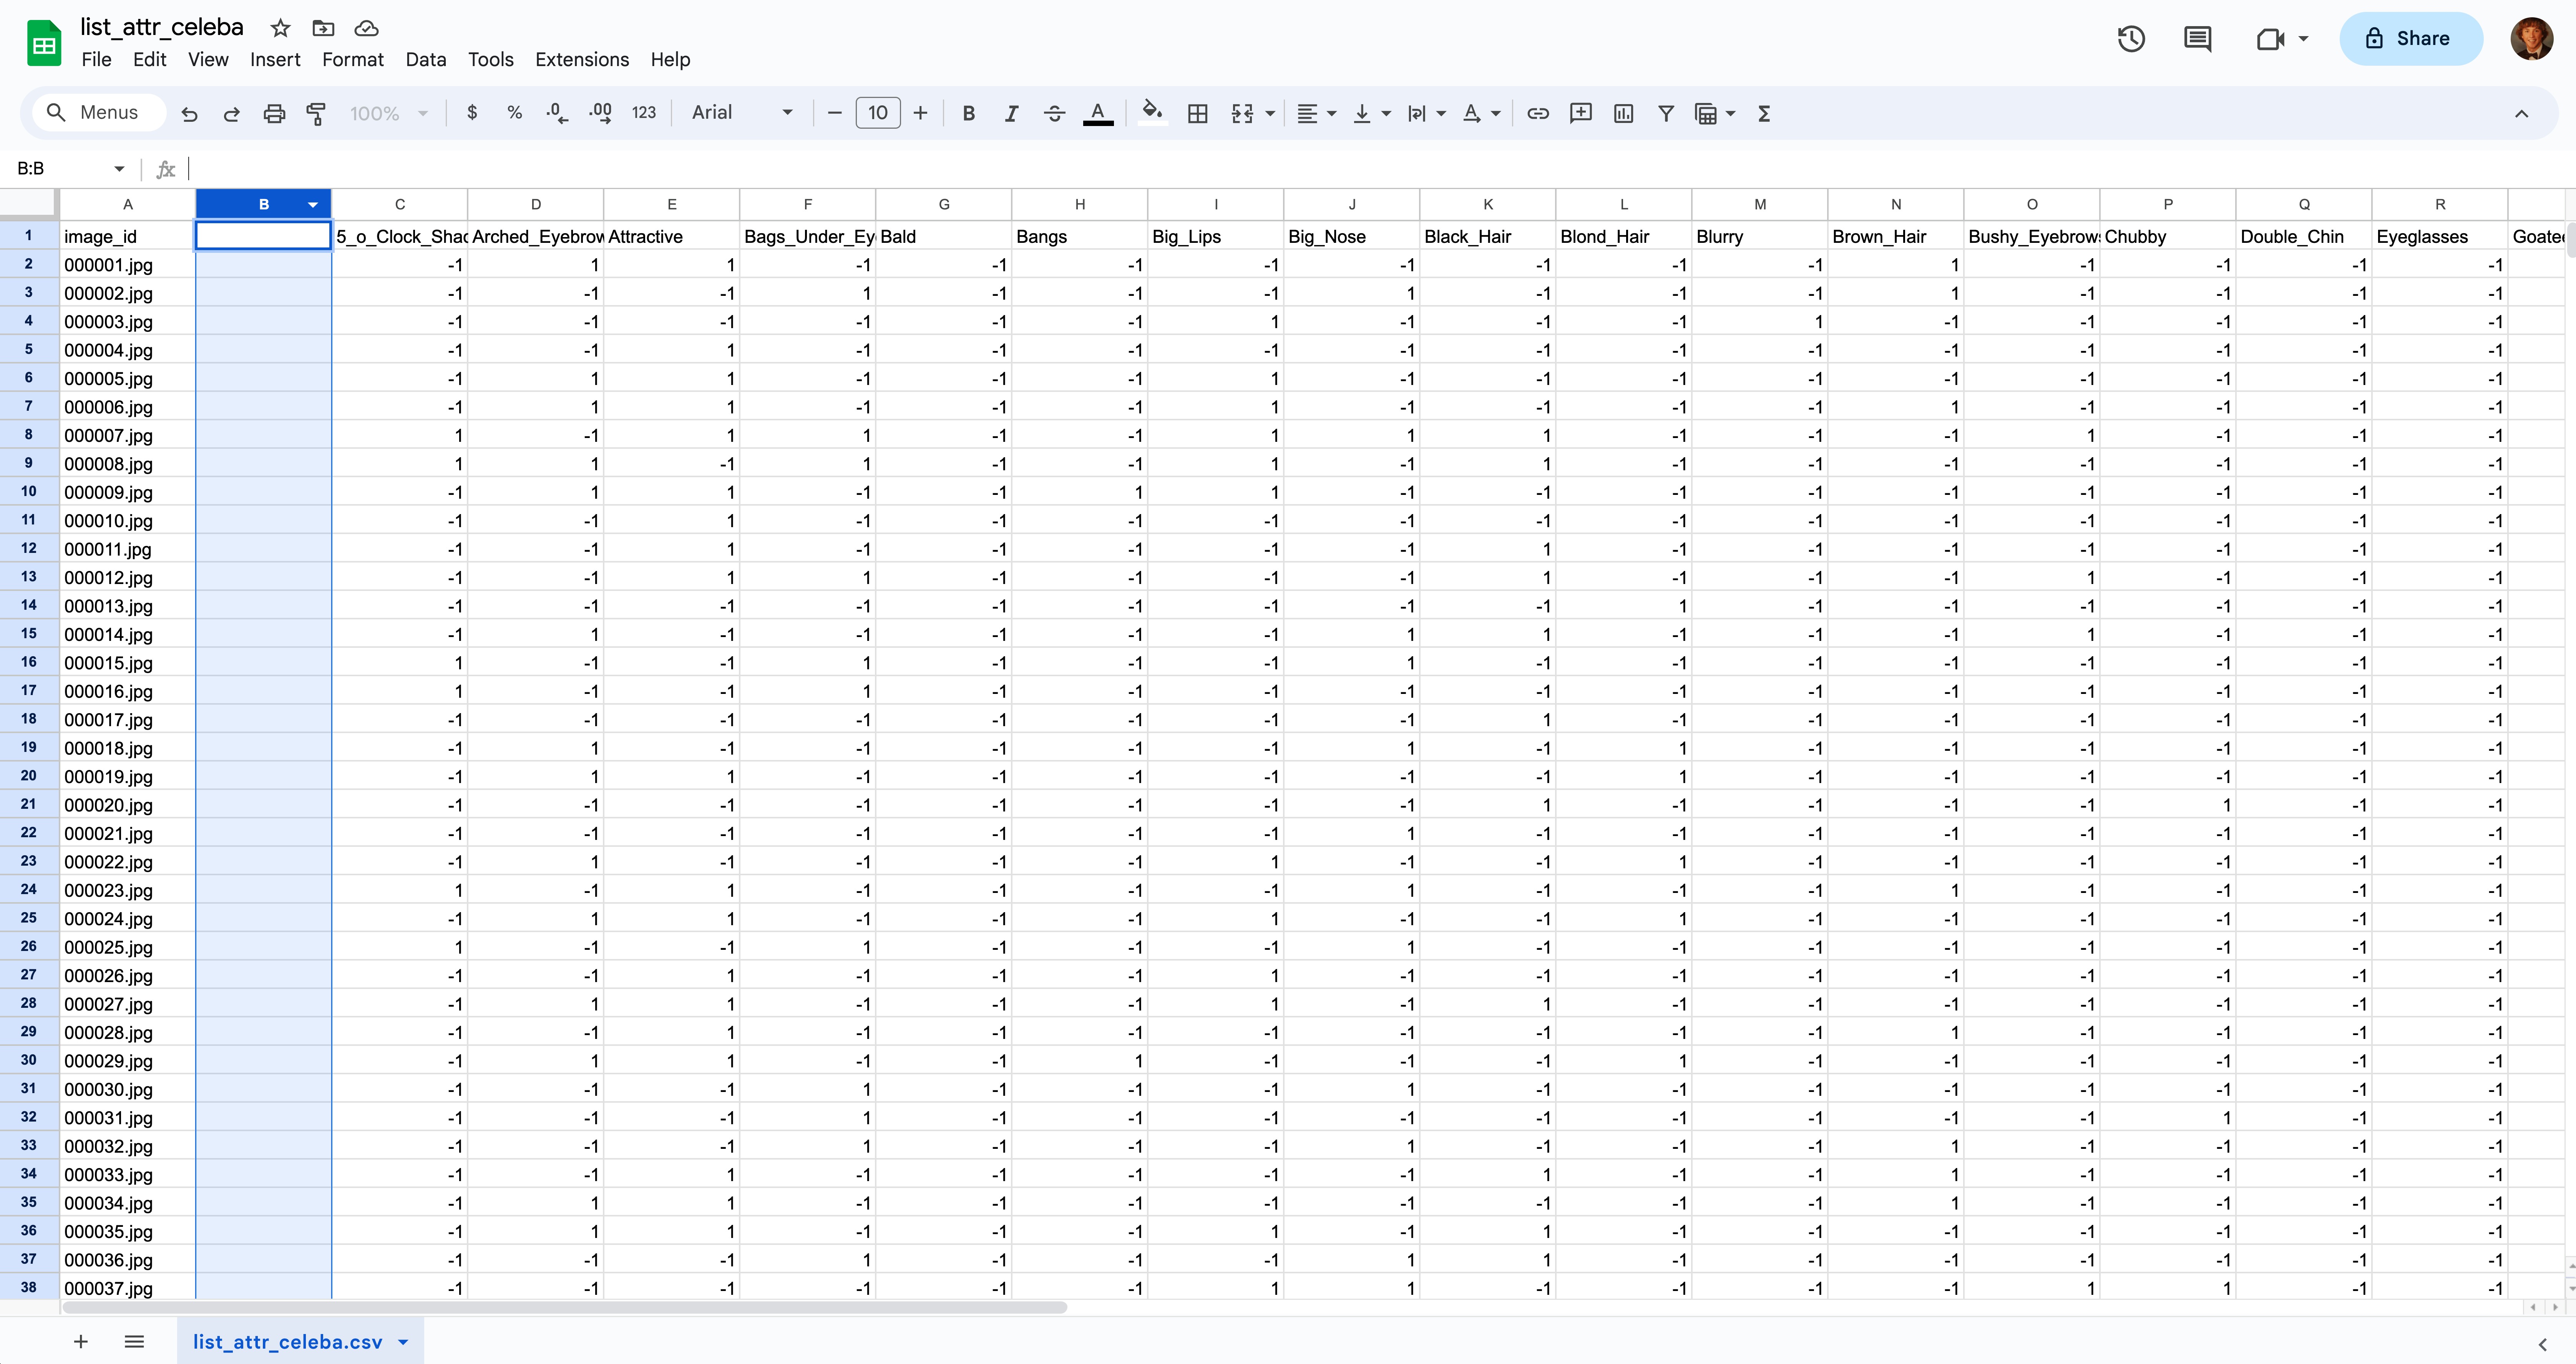
Step 1: Right click on the header of column A and select “Insert 1 column right”. You should now have an empty column B.
Step 2: Select cell B2 and paste this formula: =ARRAYFORMULA(TEXTJOIN(",", TRUE, IF(C2:AP2=1, $C$1:$AP$1, ""))) and press ⏎ Enter. Give it a few seconds and you should see all of the applicable class labels appended together with commas. If you want to learn what this formula is doing, you can read more in the appendix at the bottom.
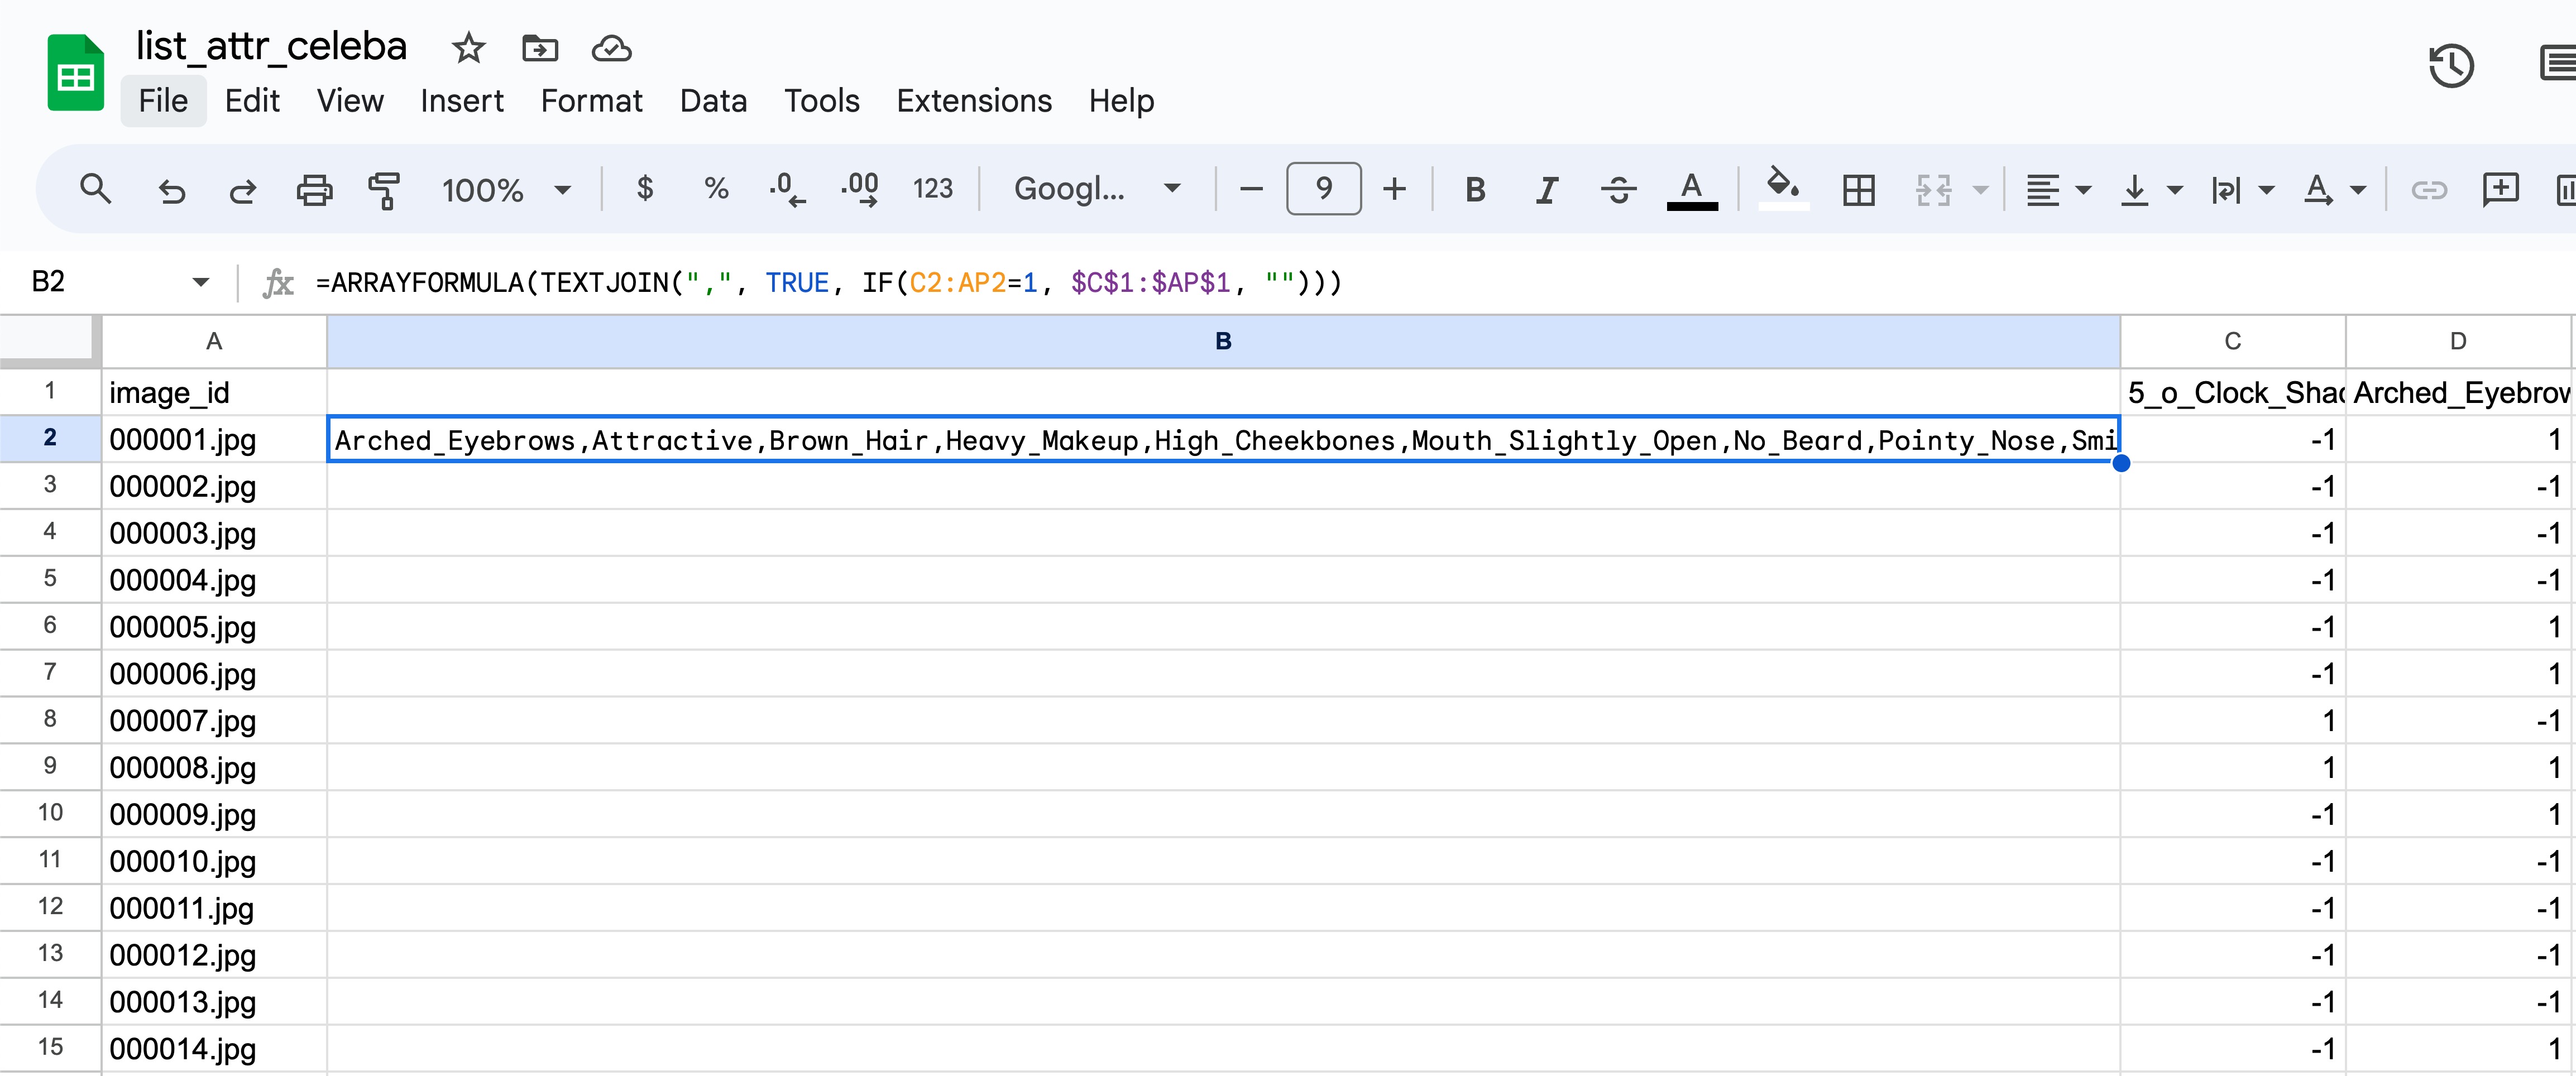
Step 3: Apply the above formula to the remainder of column B. This can be done in two ways:
Method 1 (slow):
- Click cell B2.
- Click and hold the small blue circle in the bottom right corner.
- Drag the dotted rectangle all the way to the bottom up column B. Wait ~30s for it to apply (see progress bar in upper right).
Method 2 (fast, shown below):
- Click cell B2.
- Scroll all the way to the bottom of the sheet (use side scroll bar). Be careful not to click on any cells in the table on the way down.
- While holding ⇧ Shift, click the last cell in column B (B202600). This should highlight all of column B.
- Press ⌘ Command + ⏎ Enter to apply the formula to all of column B. Wait ~30s for it to apply (see progress bar in upper right).
Step 4 - IMPORTANT: Convert the formula-computed values in column B to text.
- Right click the header of column B.
- Click “Copy”. Be patient.
- Right click the header of column B again.
- Click “Paste special -> Values only”.
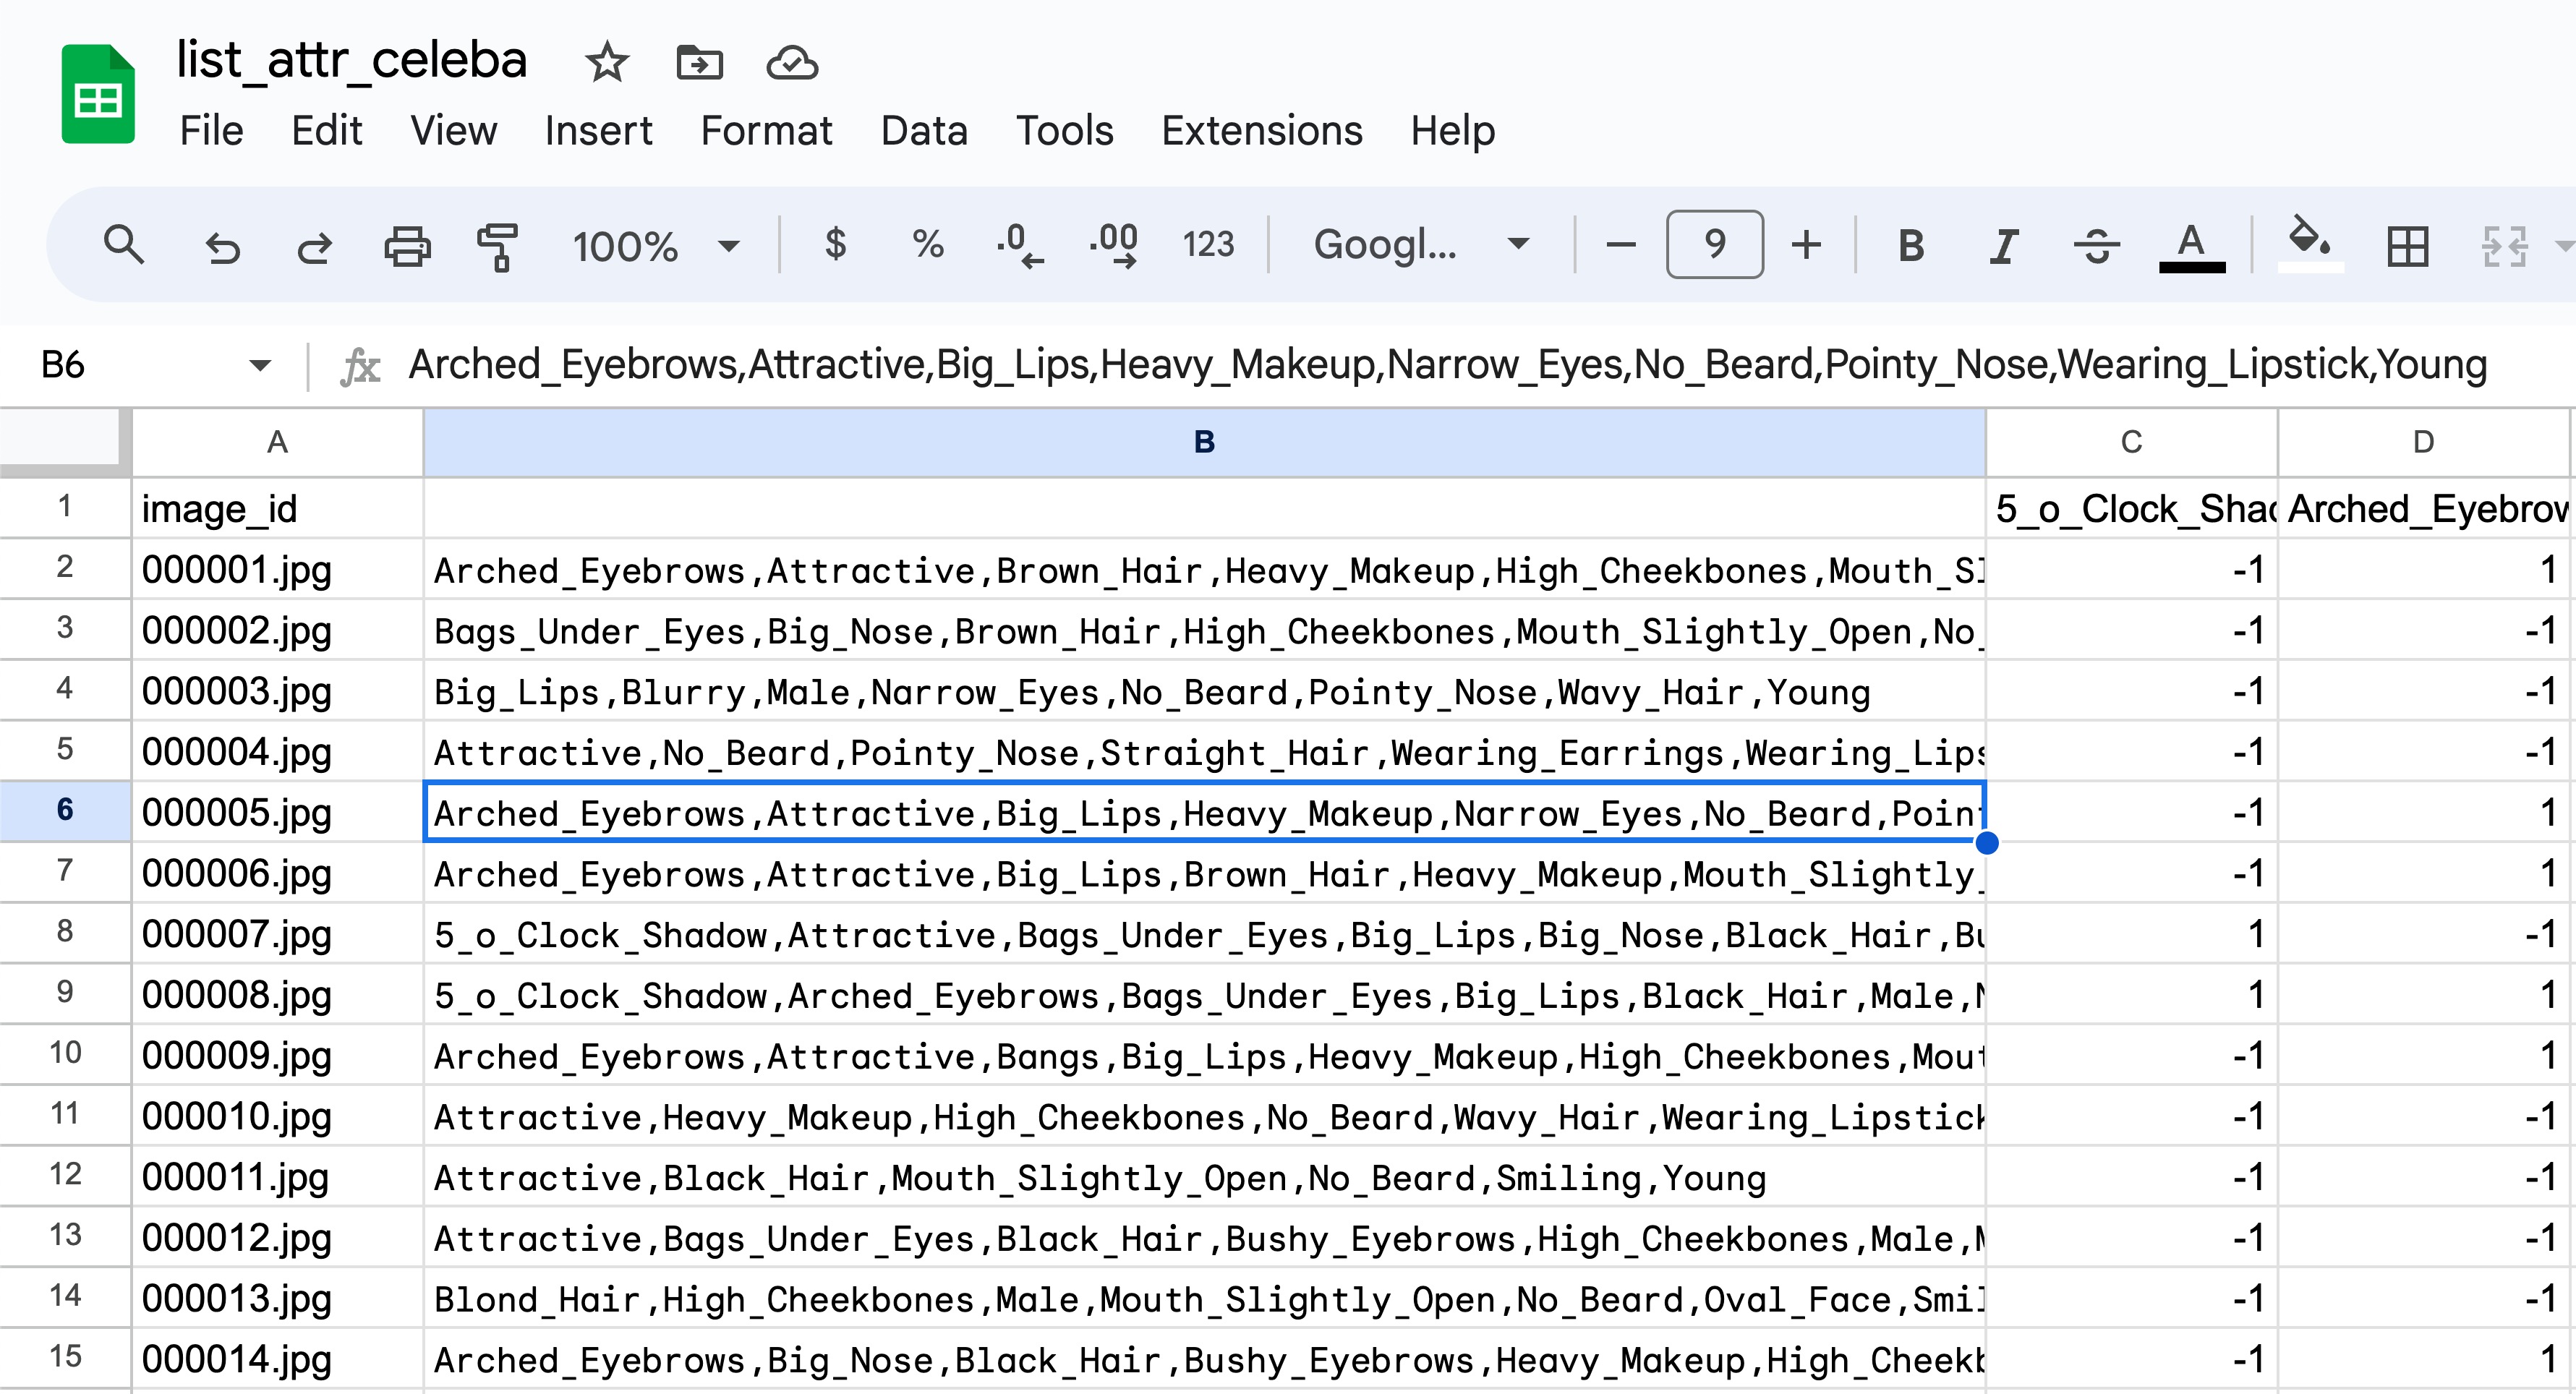
Confirm this worked by clicking one of the cells in column B, making sure you see text in the formula (fx) section and not the actual formula we used above.
Remove and rename columns
Step 1: Delete all of the individual class labels, columns C through AP.
- Click the header of column C.
- Scroll all the way right to column AP.
- While holding ⇧ Shift, click the header of column AP.
- Right click the header (blue area) and select “Delete columns C - AP”
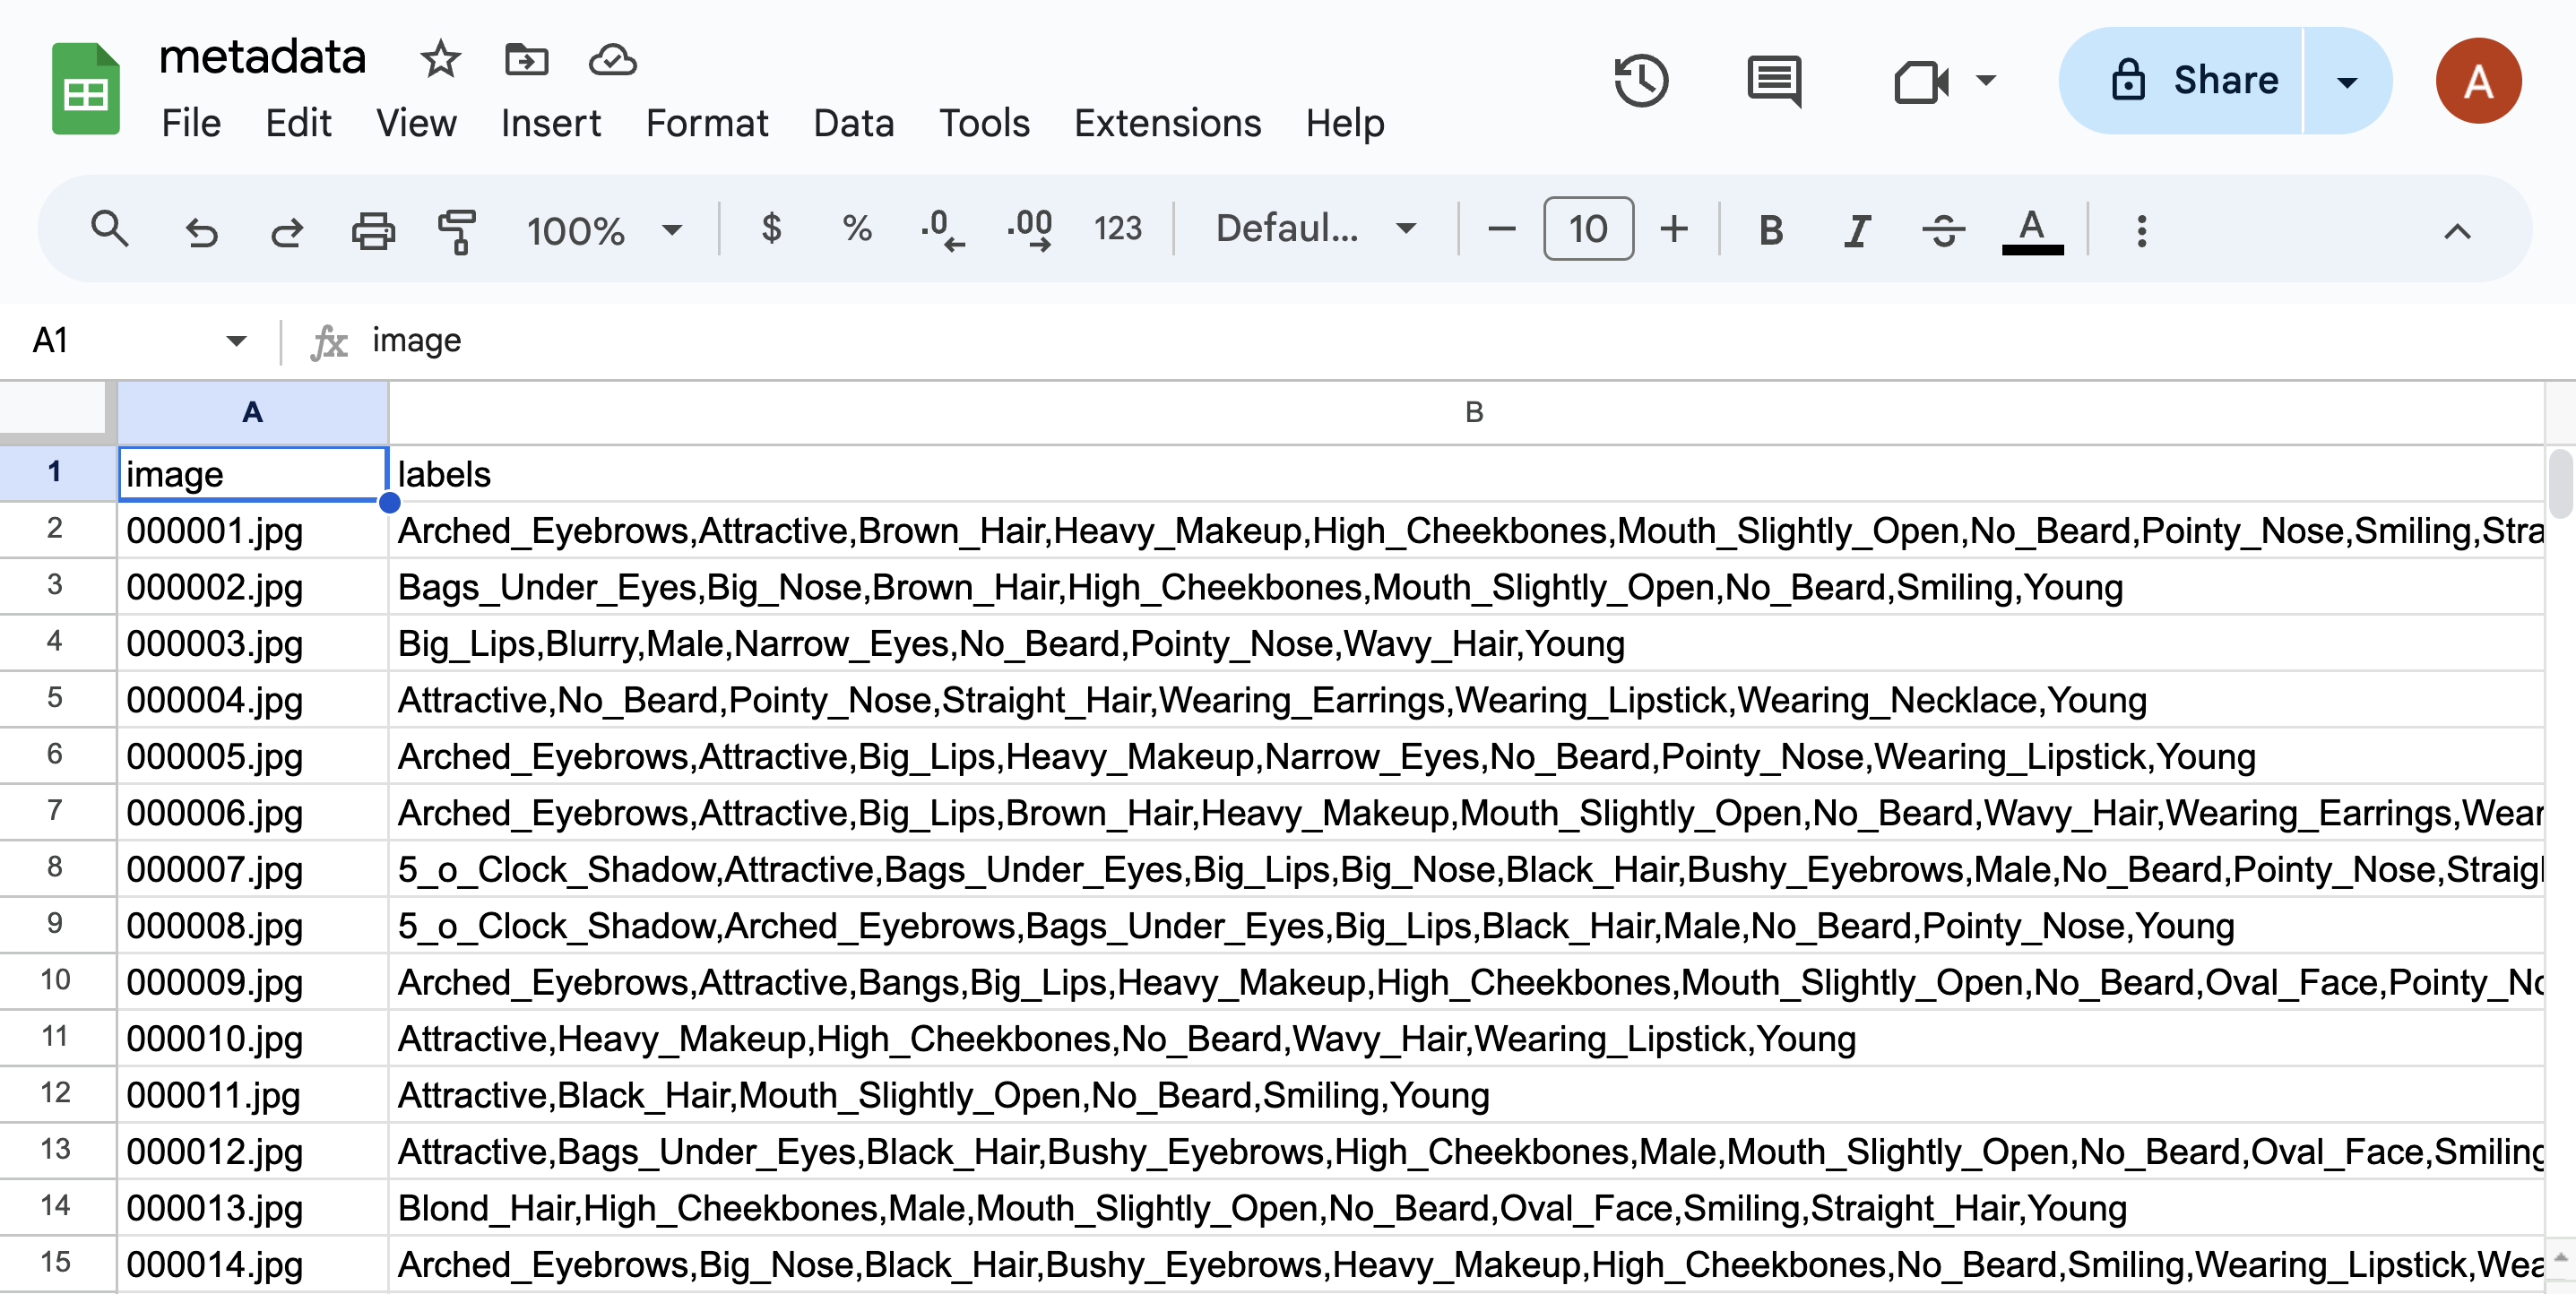
Step 2: Rename column A (“image_id) to “image” by single clicking A1 and typing “image”.
Step 3: Add names to your two columns. Type “filepath” in A1 and “labels” in B1.
You should be left with a spreadsheet like this.
Export and Zip
Step 1: Rename the file at the top by double clicking the name and typing “metadata”.
Step 2: Export this sheet to CSV by clicking “File -> Download -> Comma Separated Values (.csv)“. Ensure the filename is metadata.csv. If you do not use this name, Cleanlab Studio will not recognize this CSV.
Step 3: Navigate to the folder that contains the images (probably at img_align_celeba/img_align_celeba/), move in metadata.csv, and zip the folder up.
You are now ready to utilize Cleanlab Studio to correct issues in your multi-label data!
Using Cleanlab Studio’s Multi-Label Interface
It only takes a few clicks for you to improve your data and train more robust models with Cleanlab Studio.
Upload
In the Cleanlab Studio app, click on Upload Dataset, and then select Upload from your computer. Upload the .zip file.
If you click the “Notify me” button, Cleanlab Studio will send you an email once your dataset has been imported, so you can feel free to come back once importing is done.
Create a Multi-Label Project
Once your dataset is uploaded to the app, select Create Project. Next, you have the option to choose: the name of your project, which columns to include, and which model type to use (fast for speed and regular for quality).
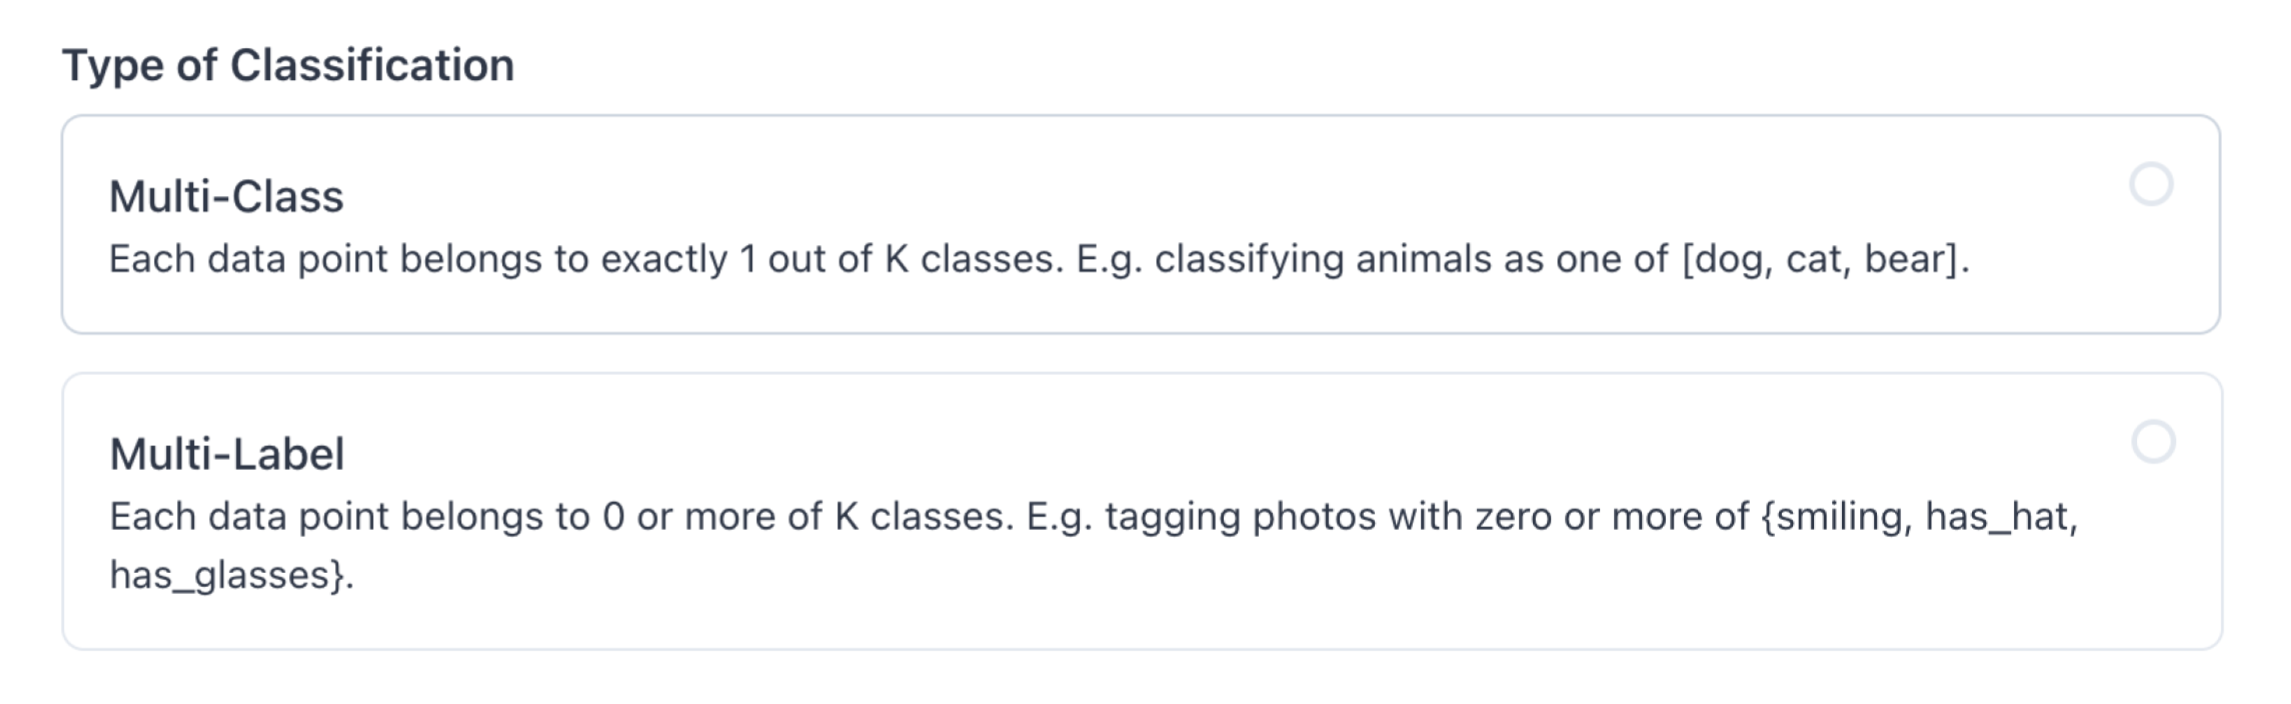
Make sure you choose Multi-Label under Type of Classification:
The project will automatically run and take some time (depending on dataset size) to complete while Cleanlab’s AI is trained to analyze your data. You’ll get an email when it is complete.
Understanding the Interface
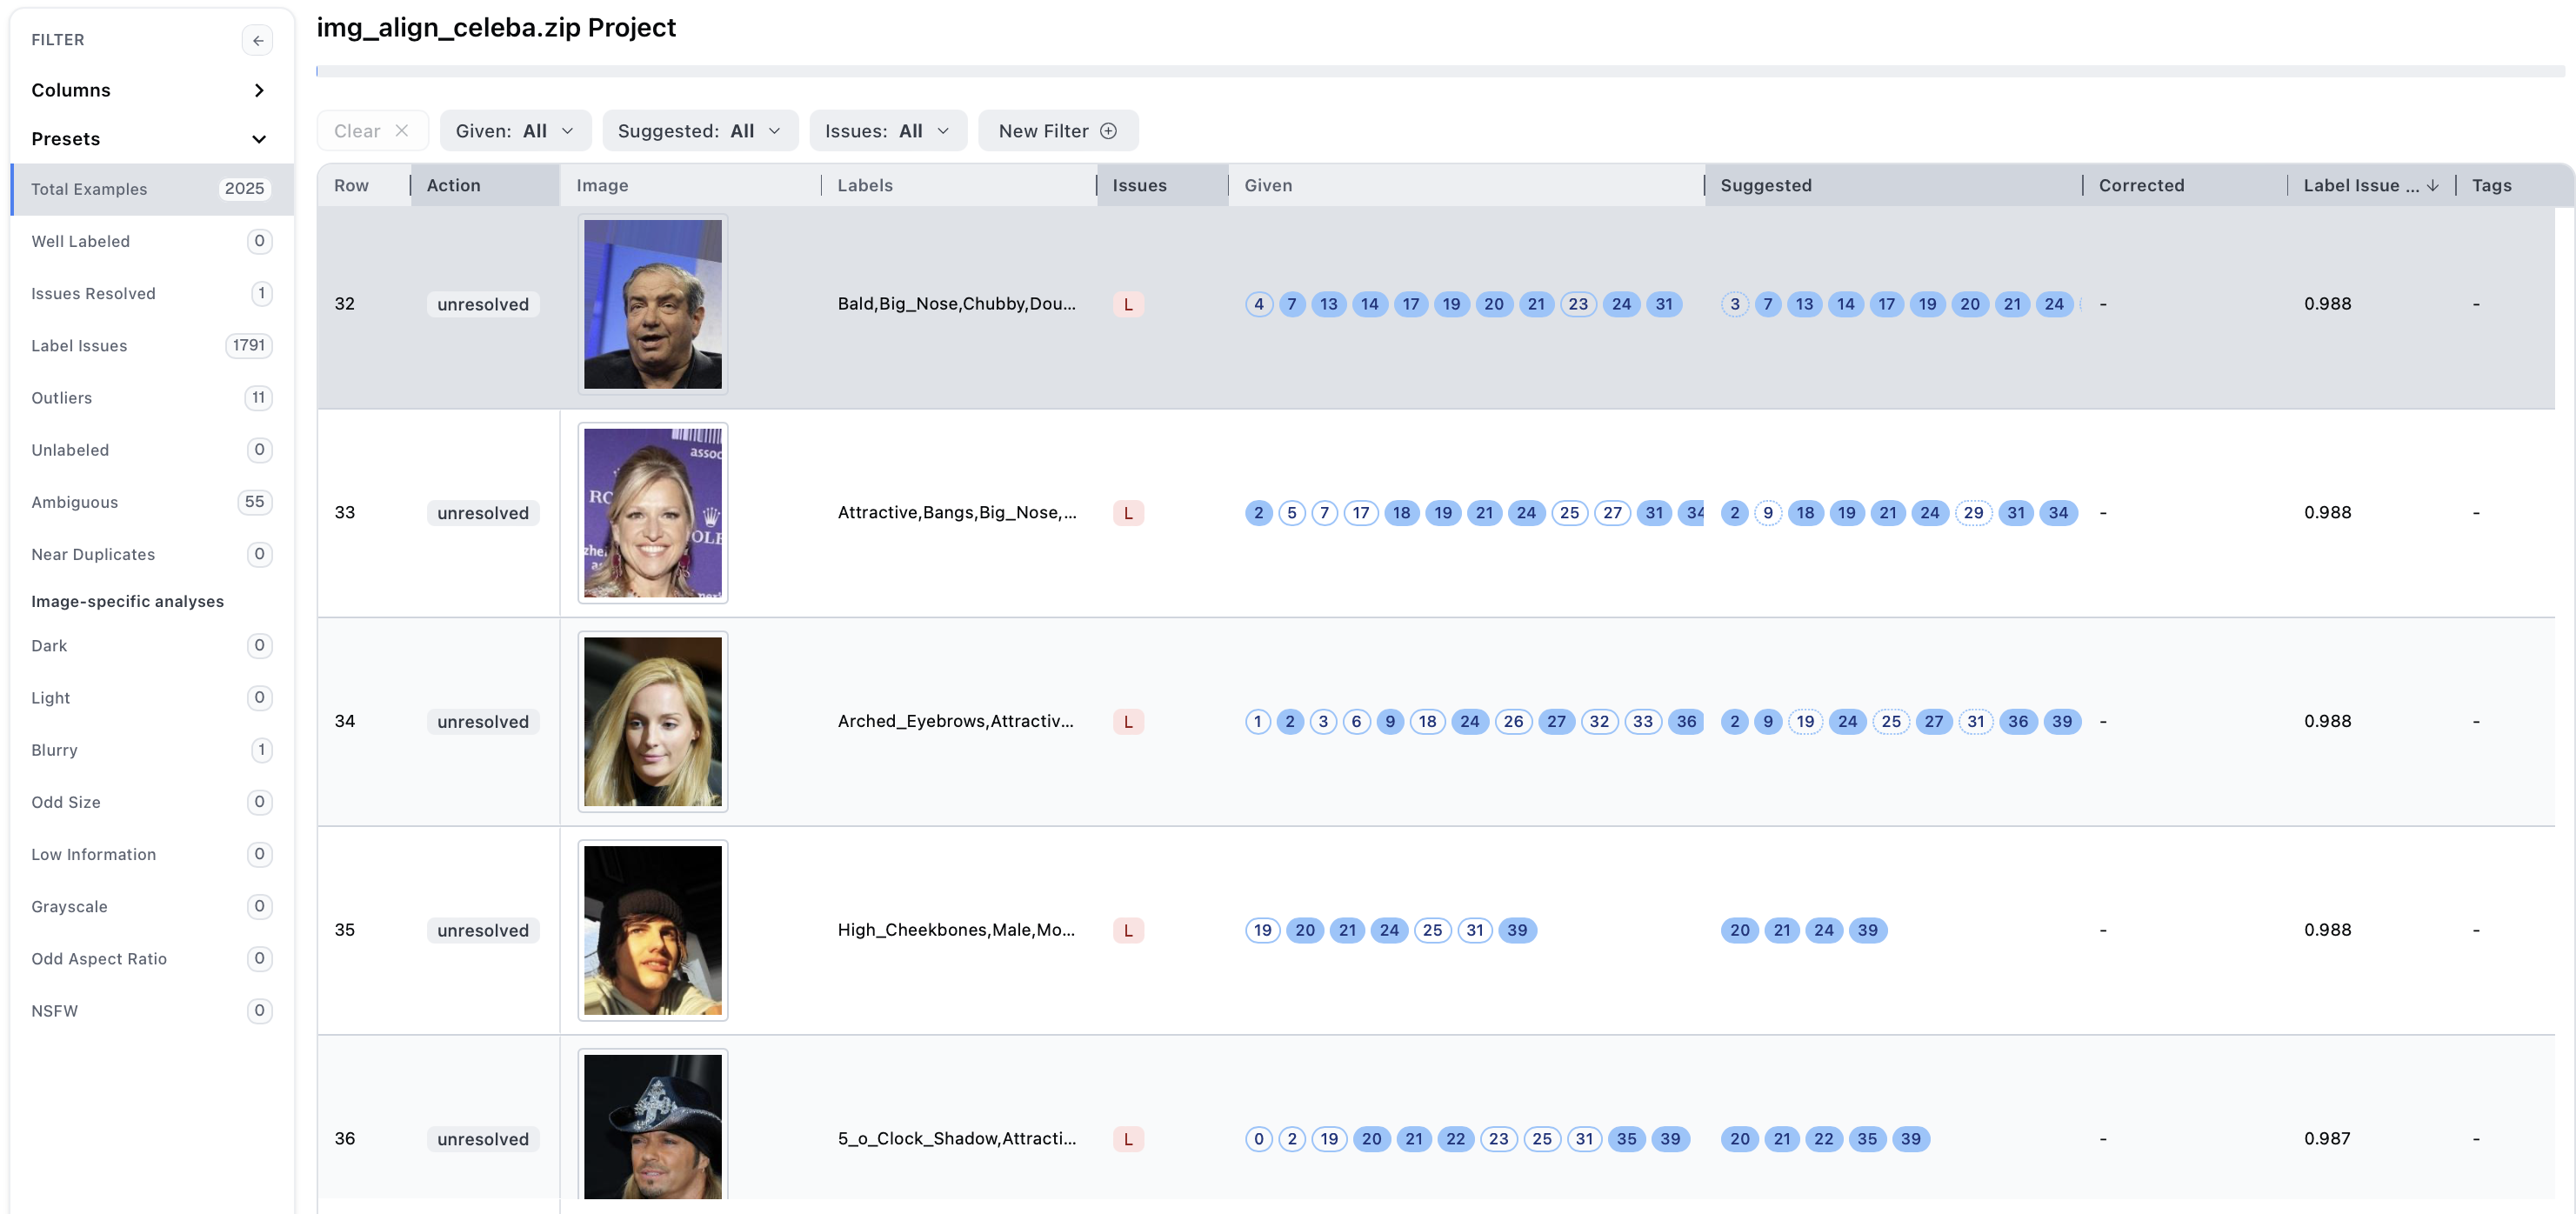
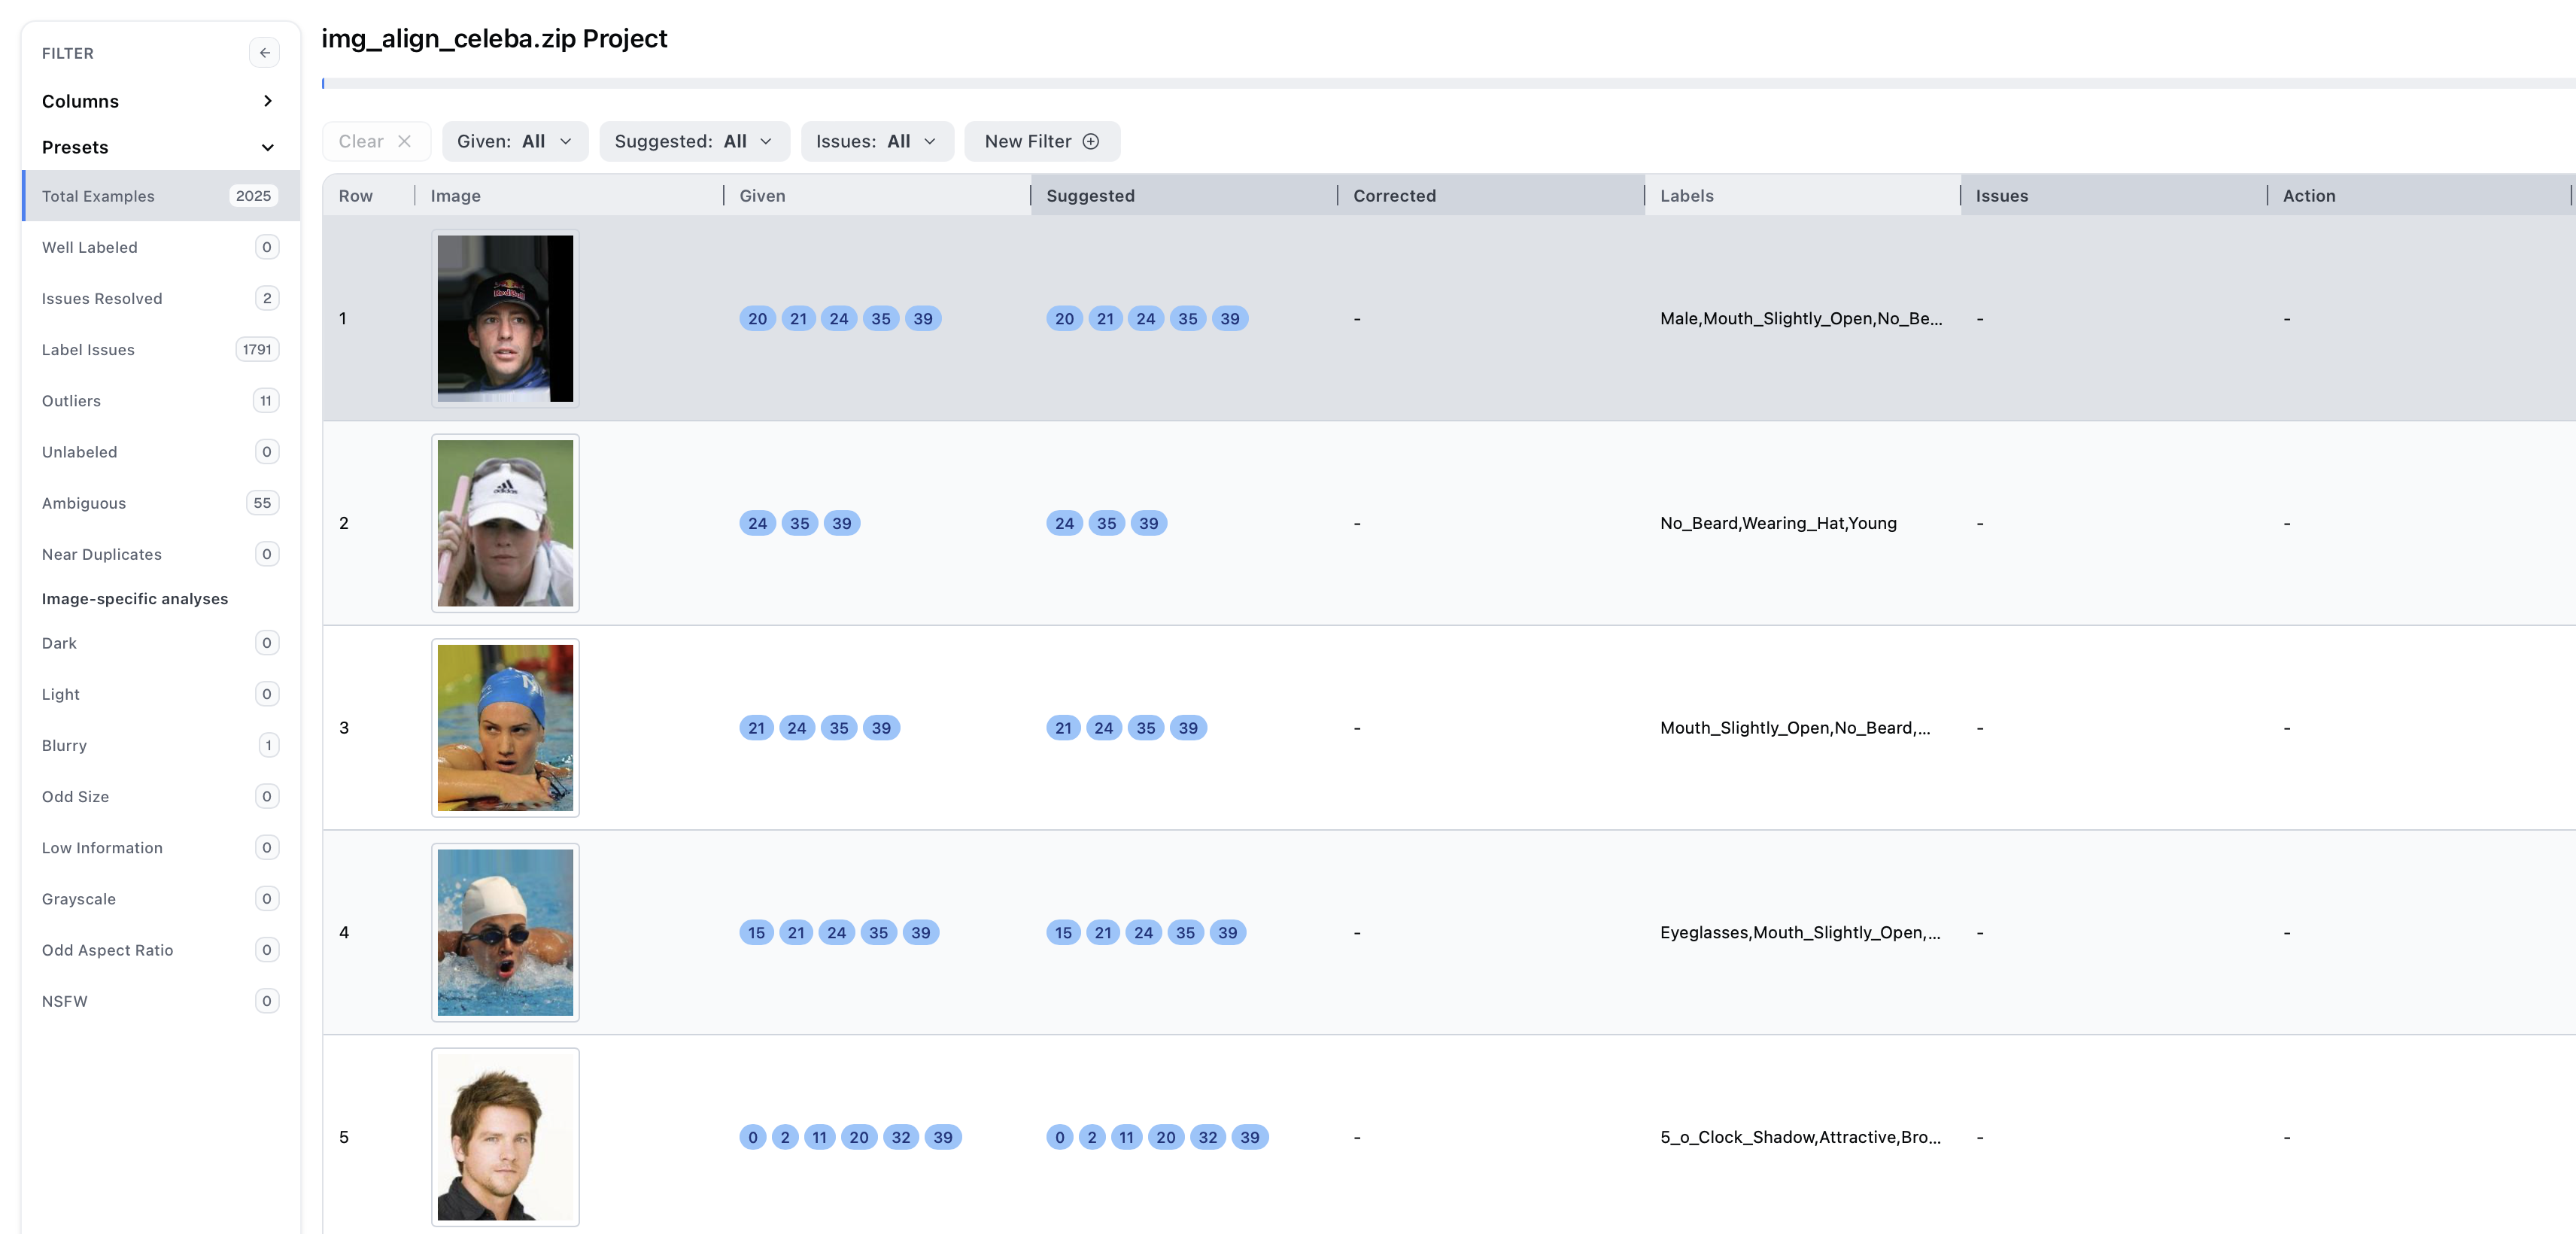
Once it is ready for review, open up your project! The project view contains many powerful tools and added metadata to help you find and fix many data issues that may be lurking in your data. You should see something like this:
Tip: if a symbol or button looks unfamiliar, hover over it to display a descriptive tooltip.
Each image from the original dataset is represented here, ranked in decreasing order by its label issue score. The light gray header denotes columns present in the dataset while the dark grey header denotes columns that Cleanlab added.
Each of the columns provides a unique piece of information:
- Given: set of labels provided in the original dataset
- Suggested: an alternate set of labels that Cleanlab predicted to be more accurate
- Corrected: the label(s) you chose to apply while correcting the data
- Issues: lists types of data issues each image exhibits (e.g., label issue, outlier, ambiguous, (near) duplicate)
- Score Columns: estimates how confident Cleanlab is that the given image exhibits a specific issue. See full list of score columns and their details here.
- Action: describes how each issue has been resolved, or unresolved if the corresponding data point has not been corrected yet.
- Tags: indicates miscellaneous properties, such as data points marked as
Needs Review
Finding and Correcting Data Issues
It’s now time to harness the power of Cleanlab Studio to fix the issues in your dataset. Cleanlab Studio has several ways you can improve data quality problems that it discovers from within the app. Many quality improvement workflows are shared between multi-class and multi-label projects (see our Quickstart guide for an introduction to the most commonly used workflows in Cleanlab Studio).
To start correction, click on any row to open the resolver panel (red box below). There, the image selected is shown along with useful metadata and buttons you can use to make corrections.
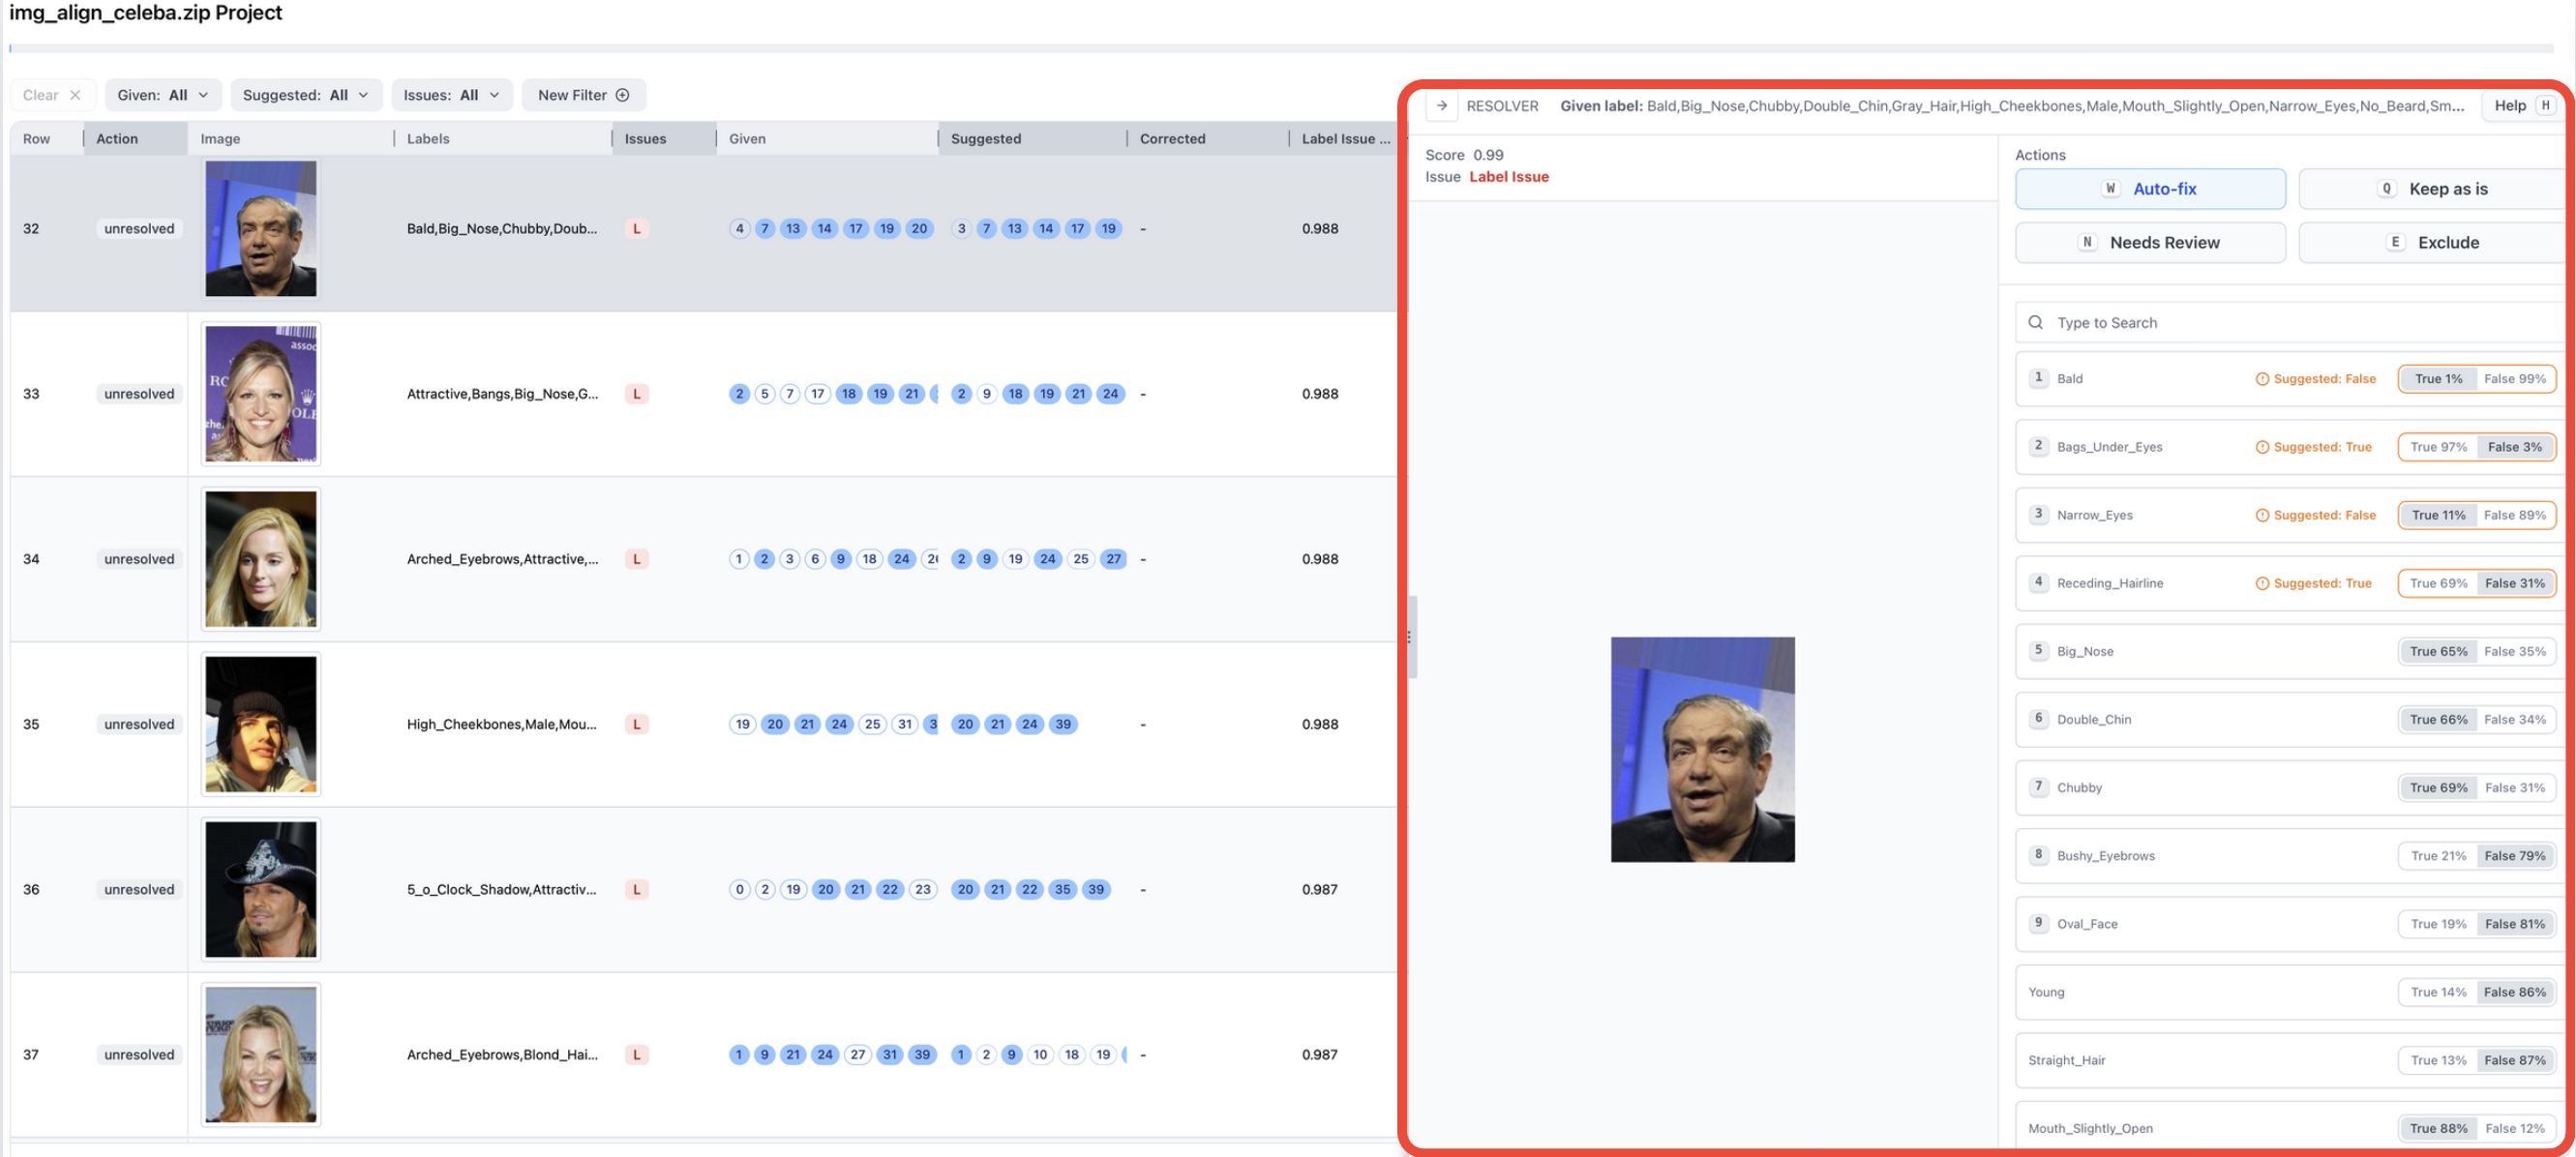
On the right side of the resolver window, the labels with a red-colored suggestion have been predicted to have incorrect annotations while the labels without any suggestions have been predicted to have correct annotations. The highlighted True/False buttons show the current state of the annotation (initially showing, for each label, whether or not it was present in the original annotation for the data point). It also contains how confident Cleanlab’s AI is about this label for this example.
The Suggested: Boolean is used to show the Cleanlab-predicted decision. If “True”, then the label is suggested to be included for this image. Otherwise, if “False”, then the label is suggested to be omitted for this image.
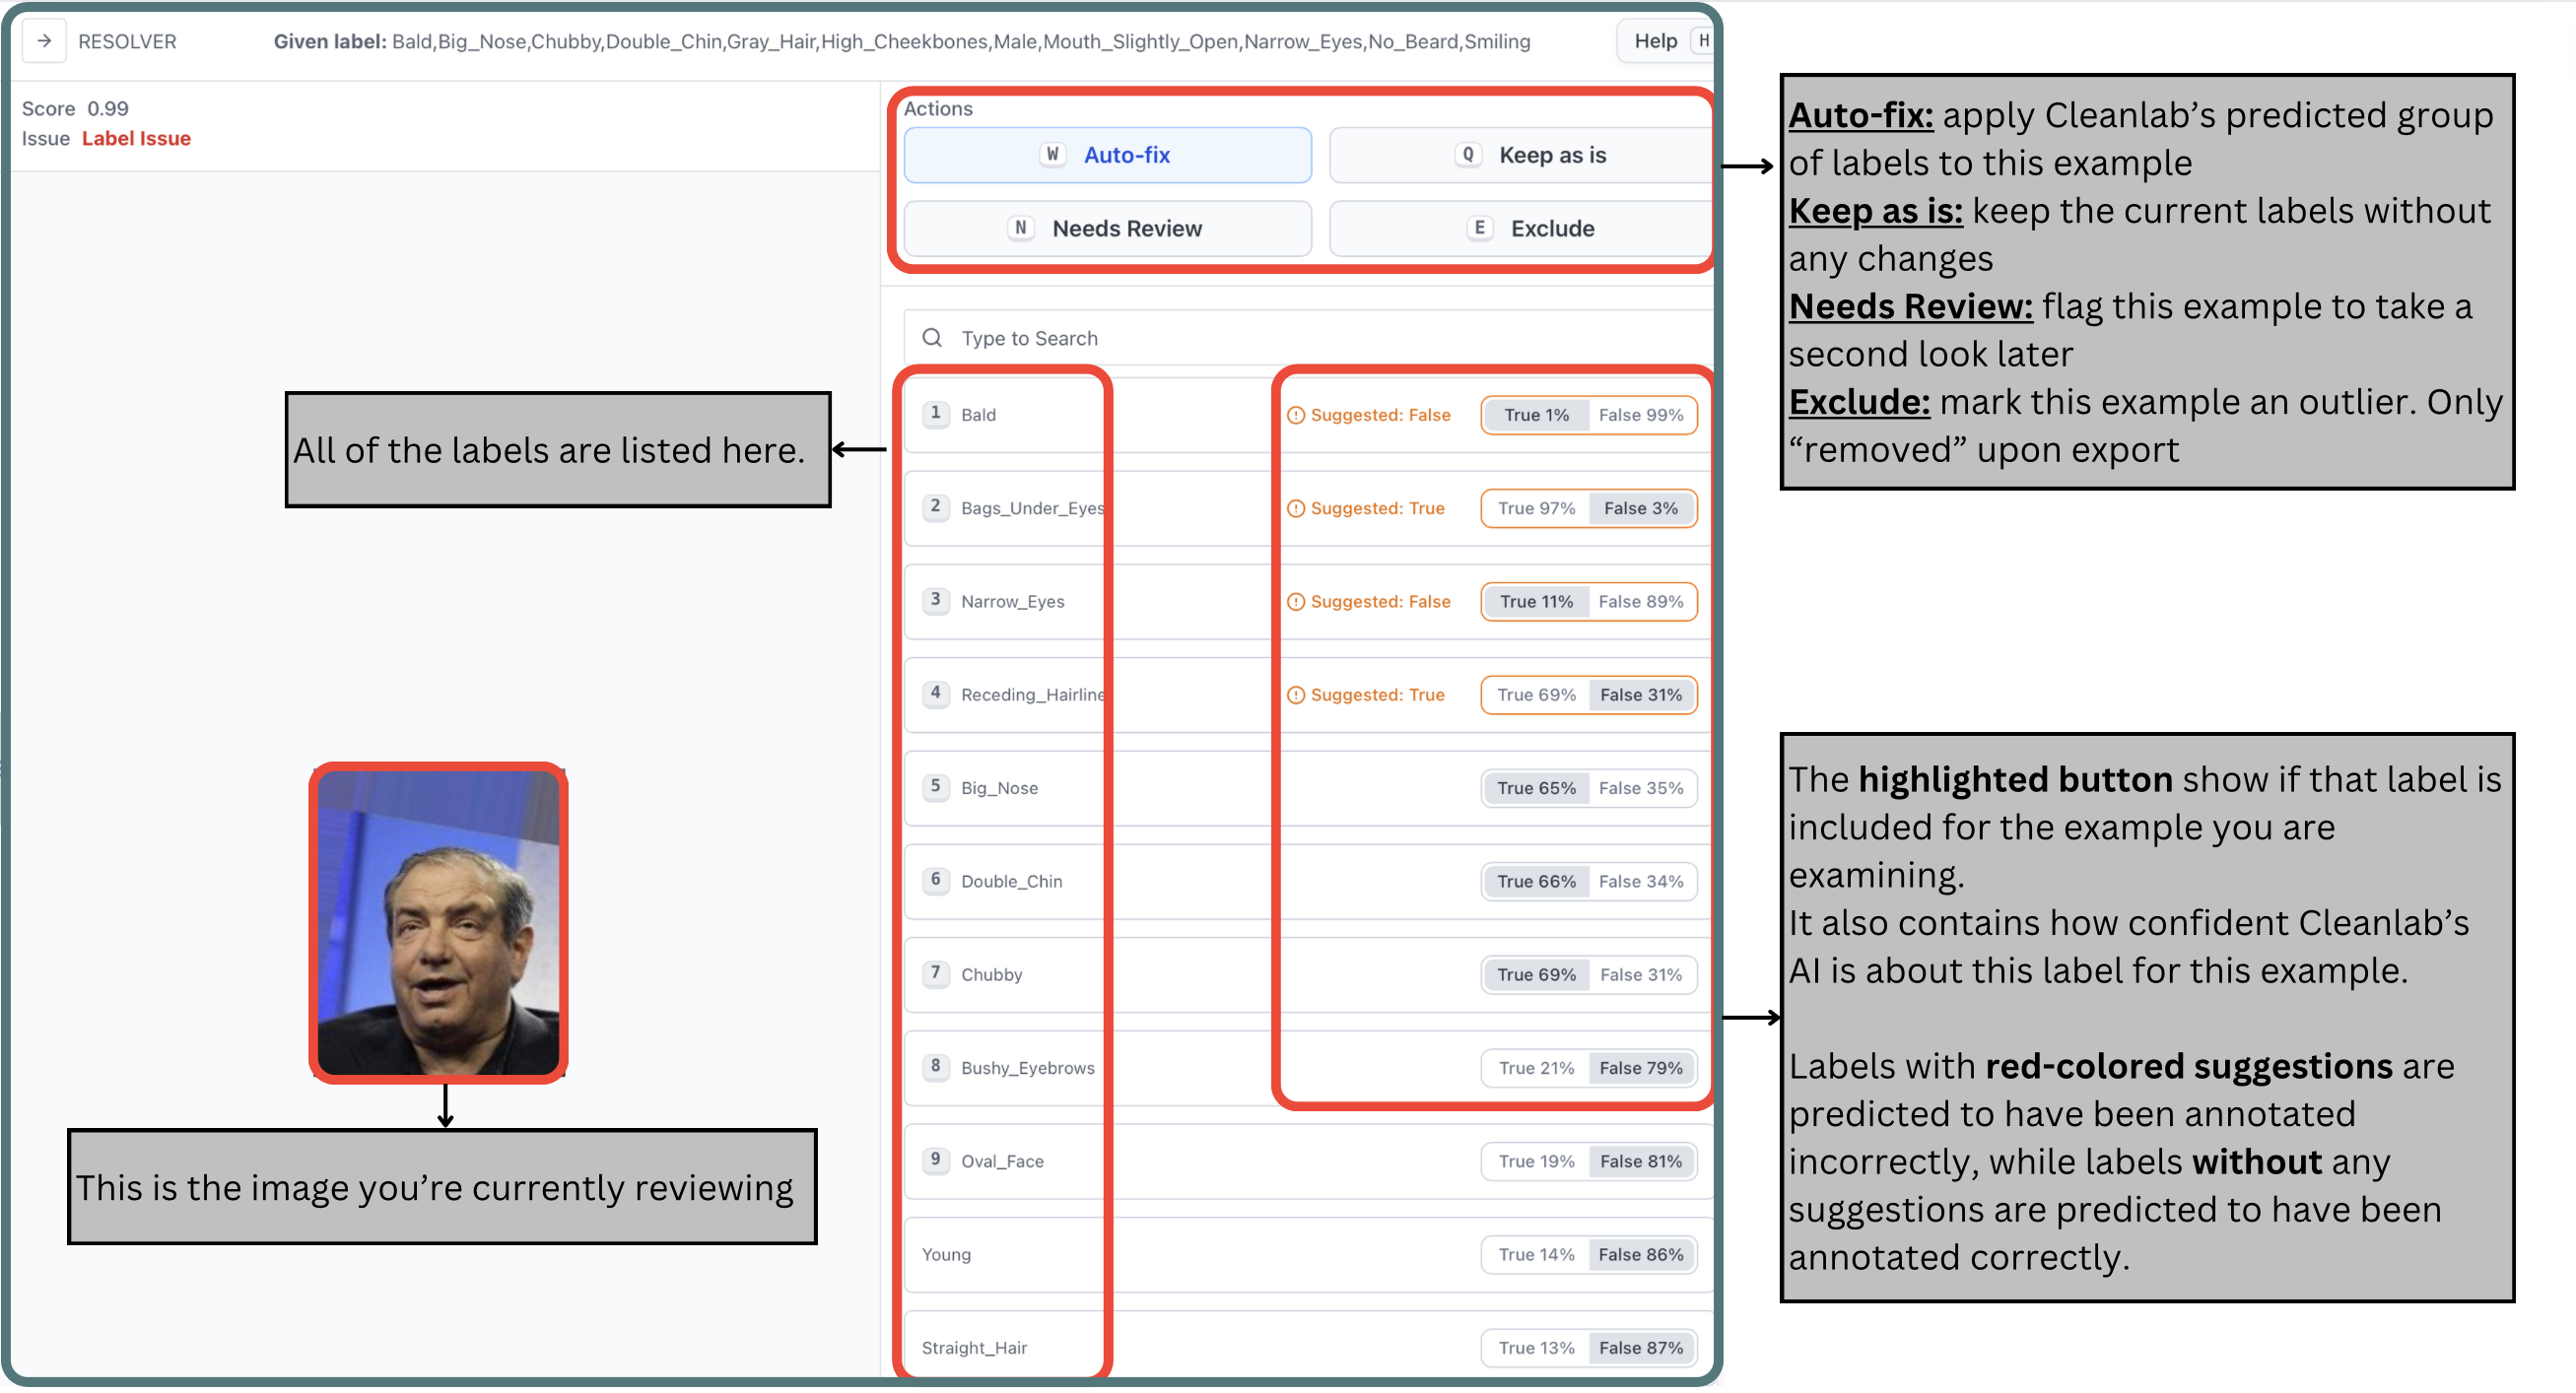
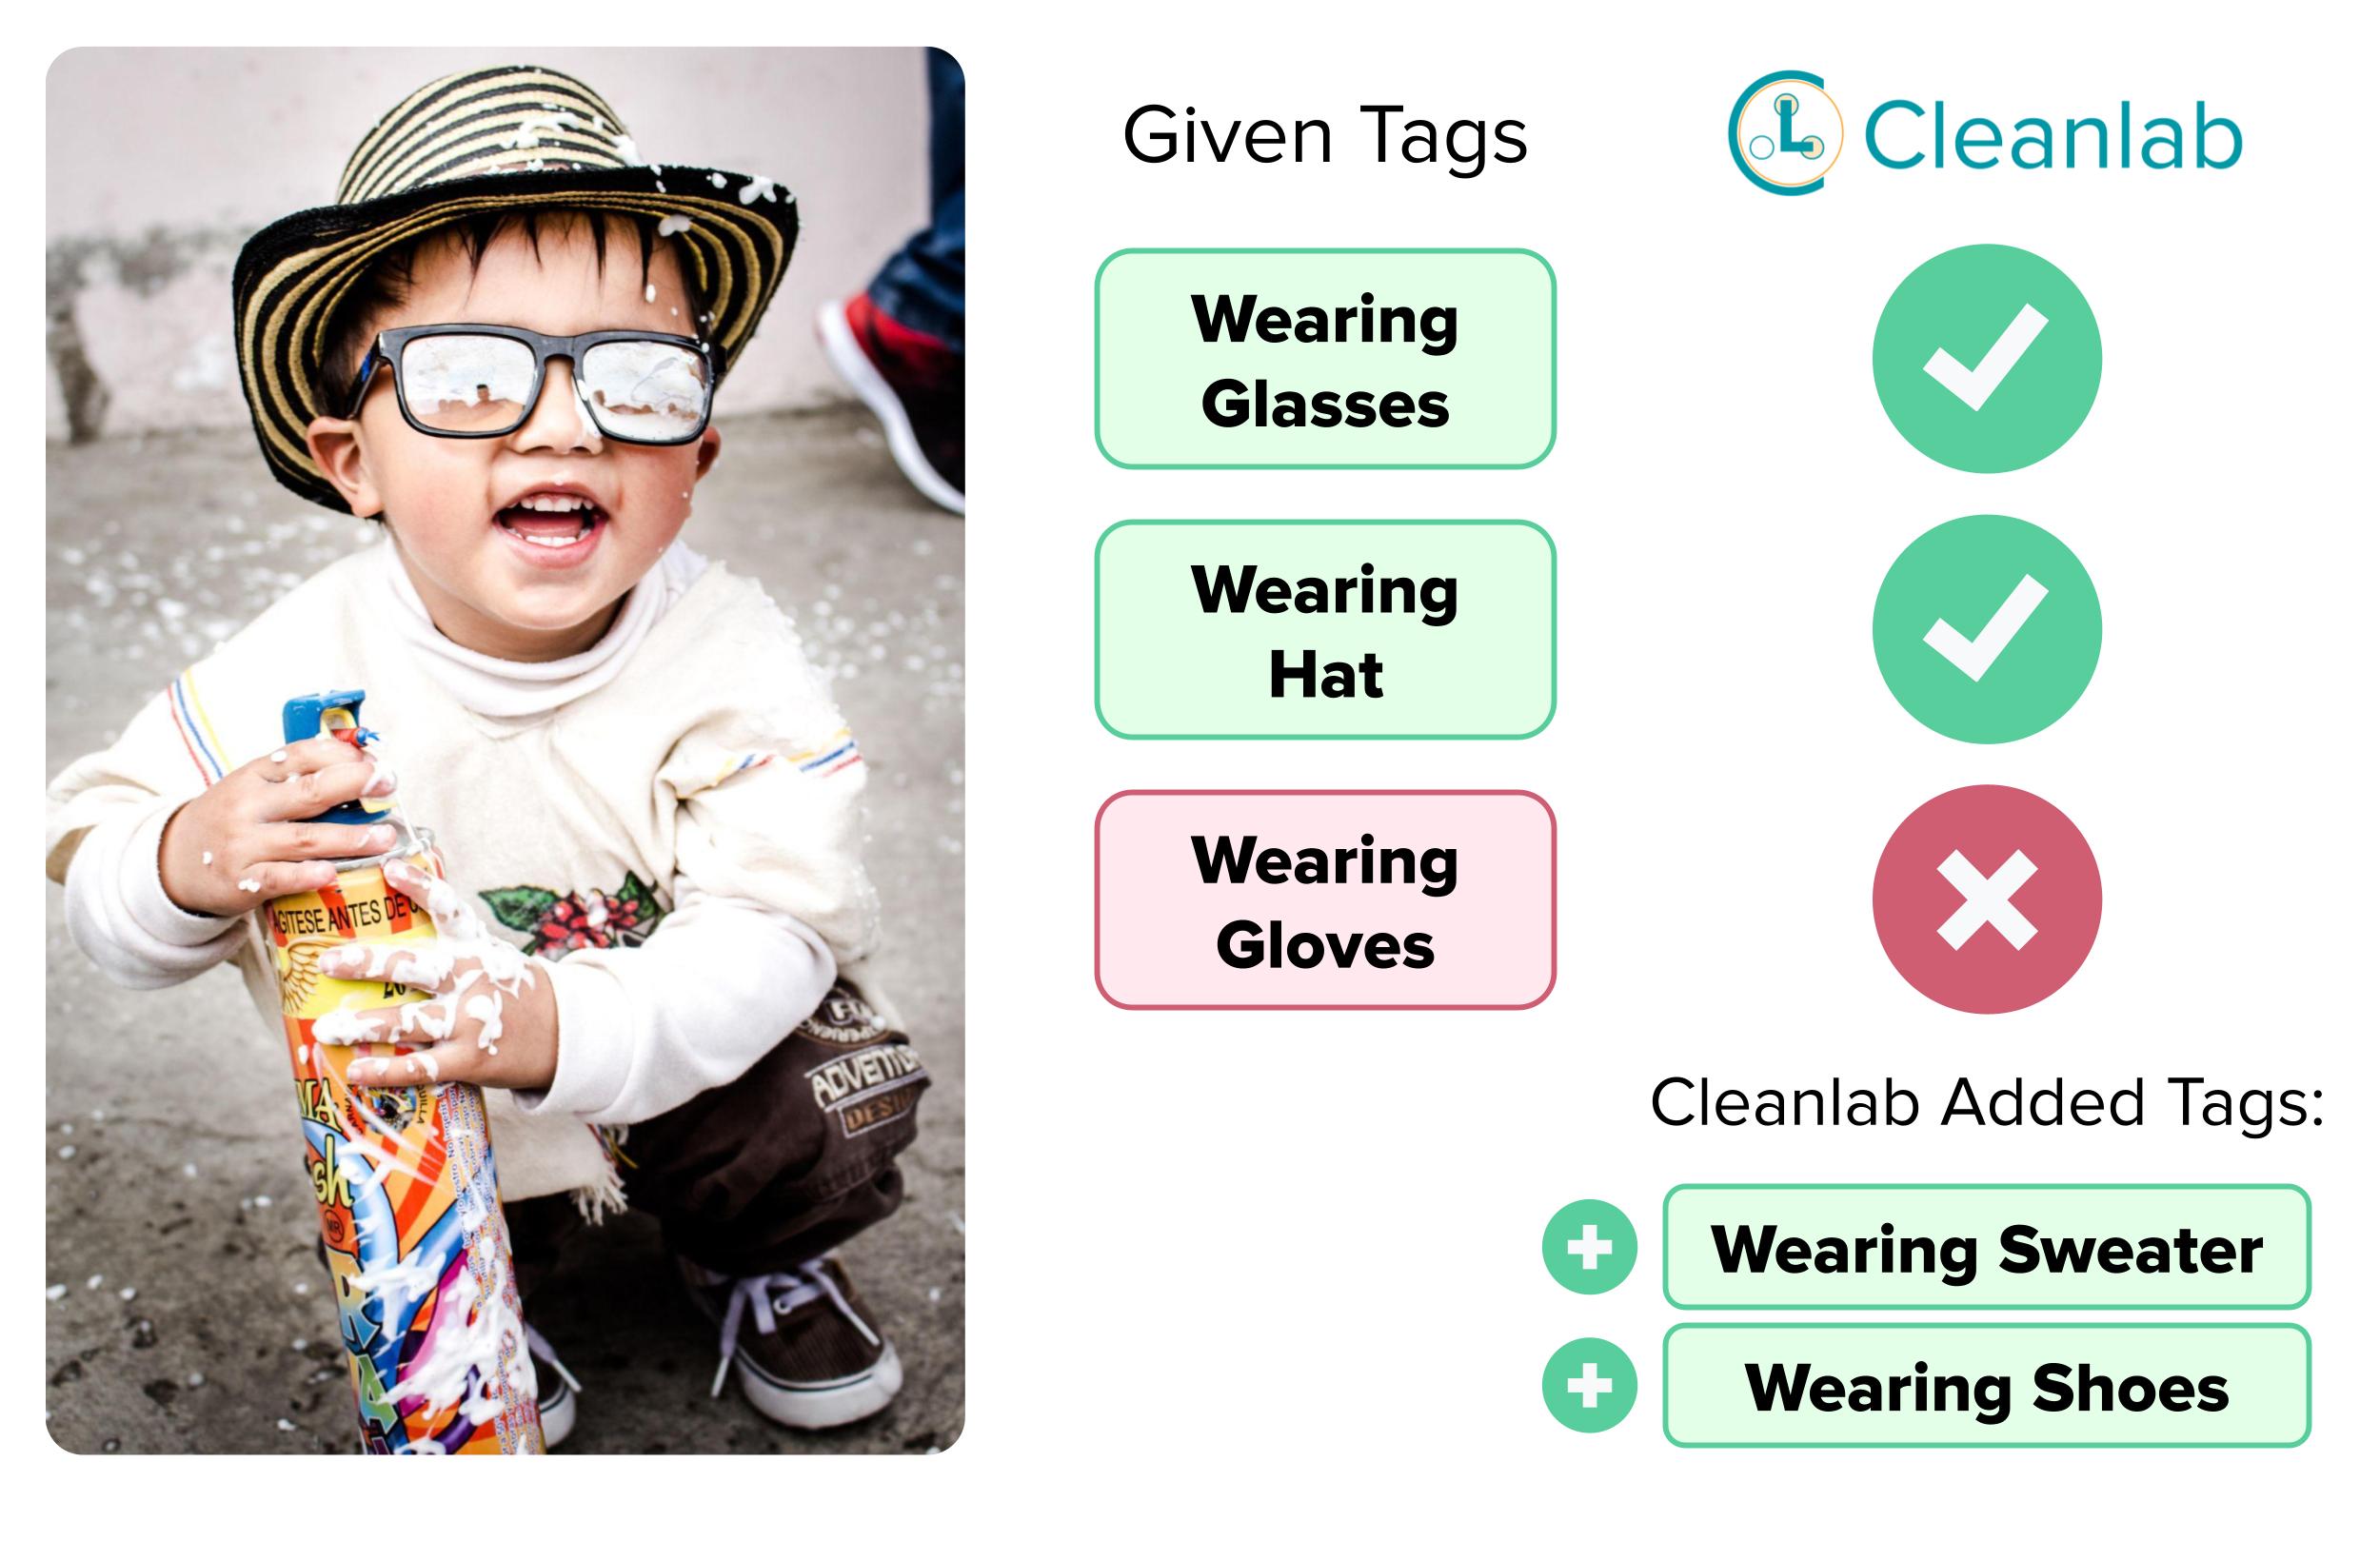
For this specific image, Cleanlab Studio has predicted that the labels Bald, and Narrow_Eyes should not be included, while the remaining labels should be. Notice in the original dataset, the given labels for this image included both of these, denoted by classes 4 & 23 respectively, and Cleanlab Studio found that these should not be included. The ones that should be included are Bags_Under_Eyes & Receding_Hairline (which were originally not included), in addition to the already included Big_Nose, Double_Chin & Chubby.
Looking at the image, you can see that Cleanlab Studio was perfectly correct! The person shown doesn’t have Narrow_Eyes, and is not Bald. To make the necessary corrections, all you need to do is click the “Auto-fix” button (or press W) so that the corrections are applied to this image.
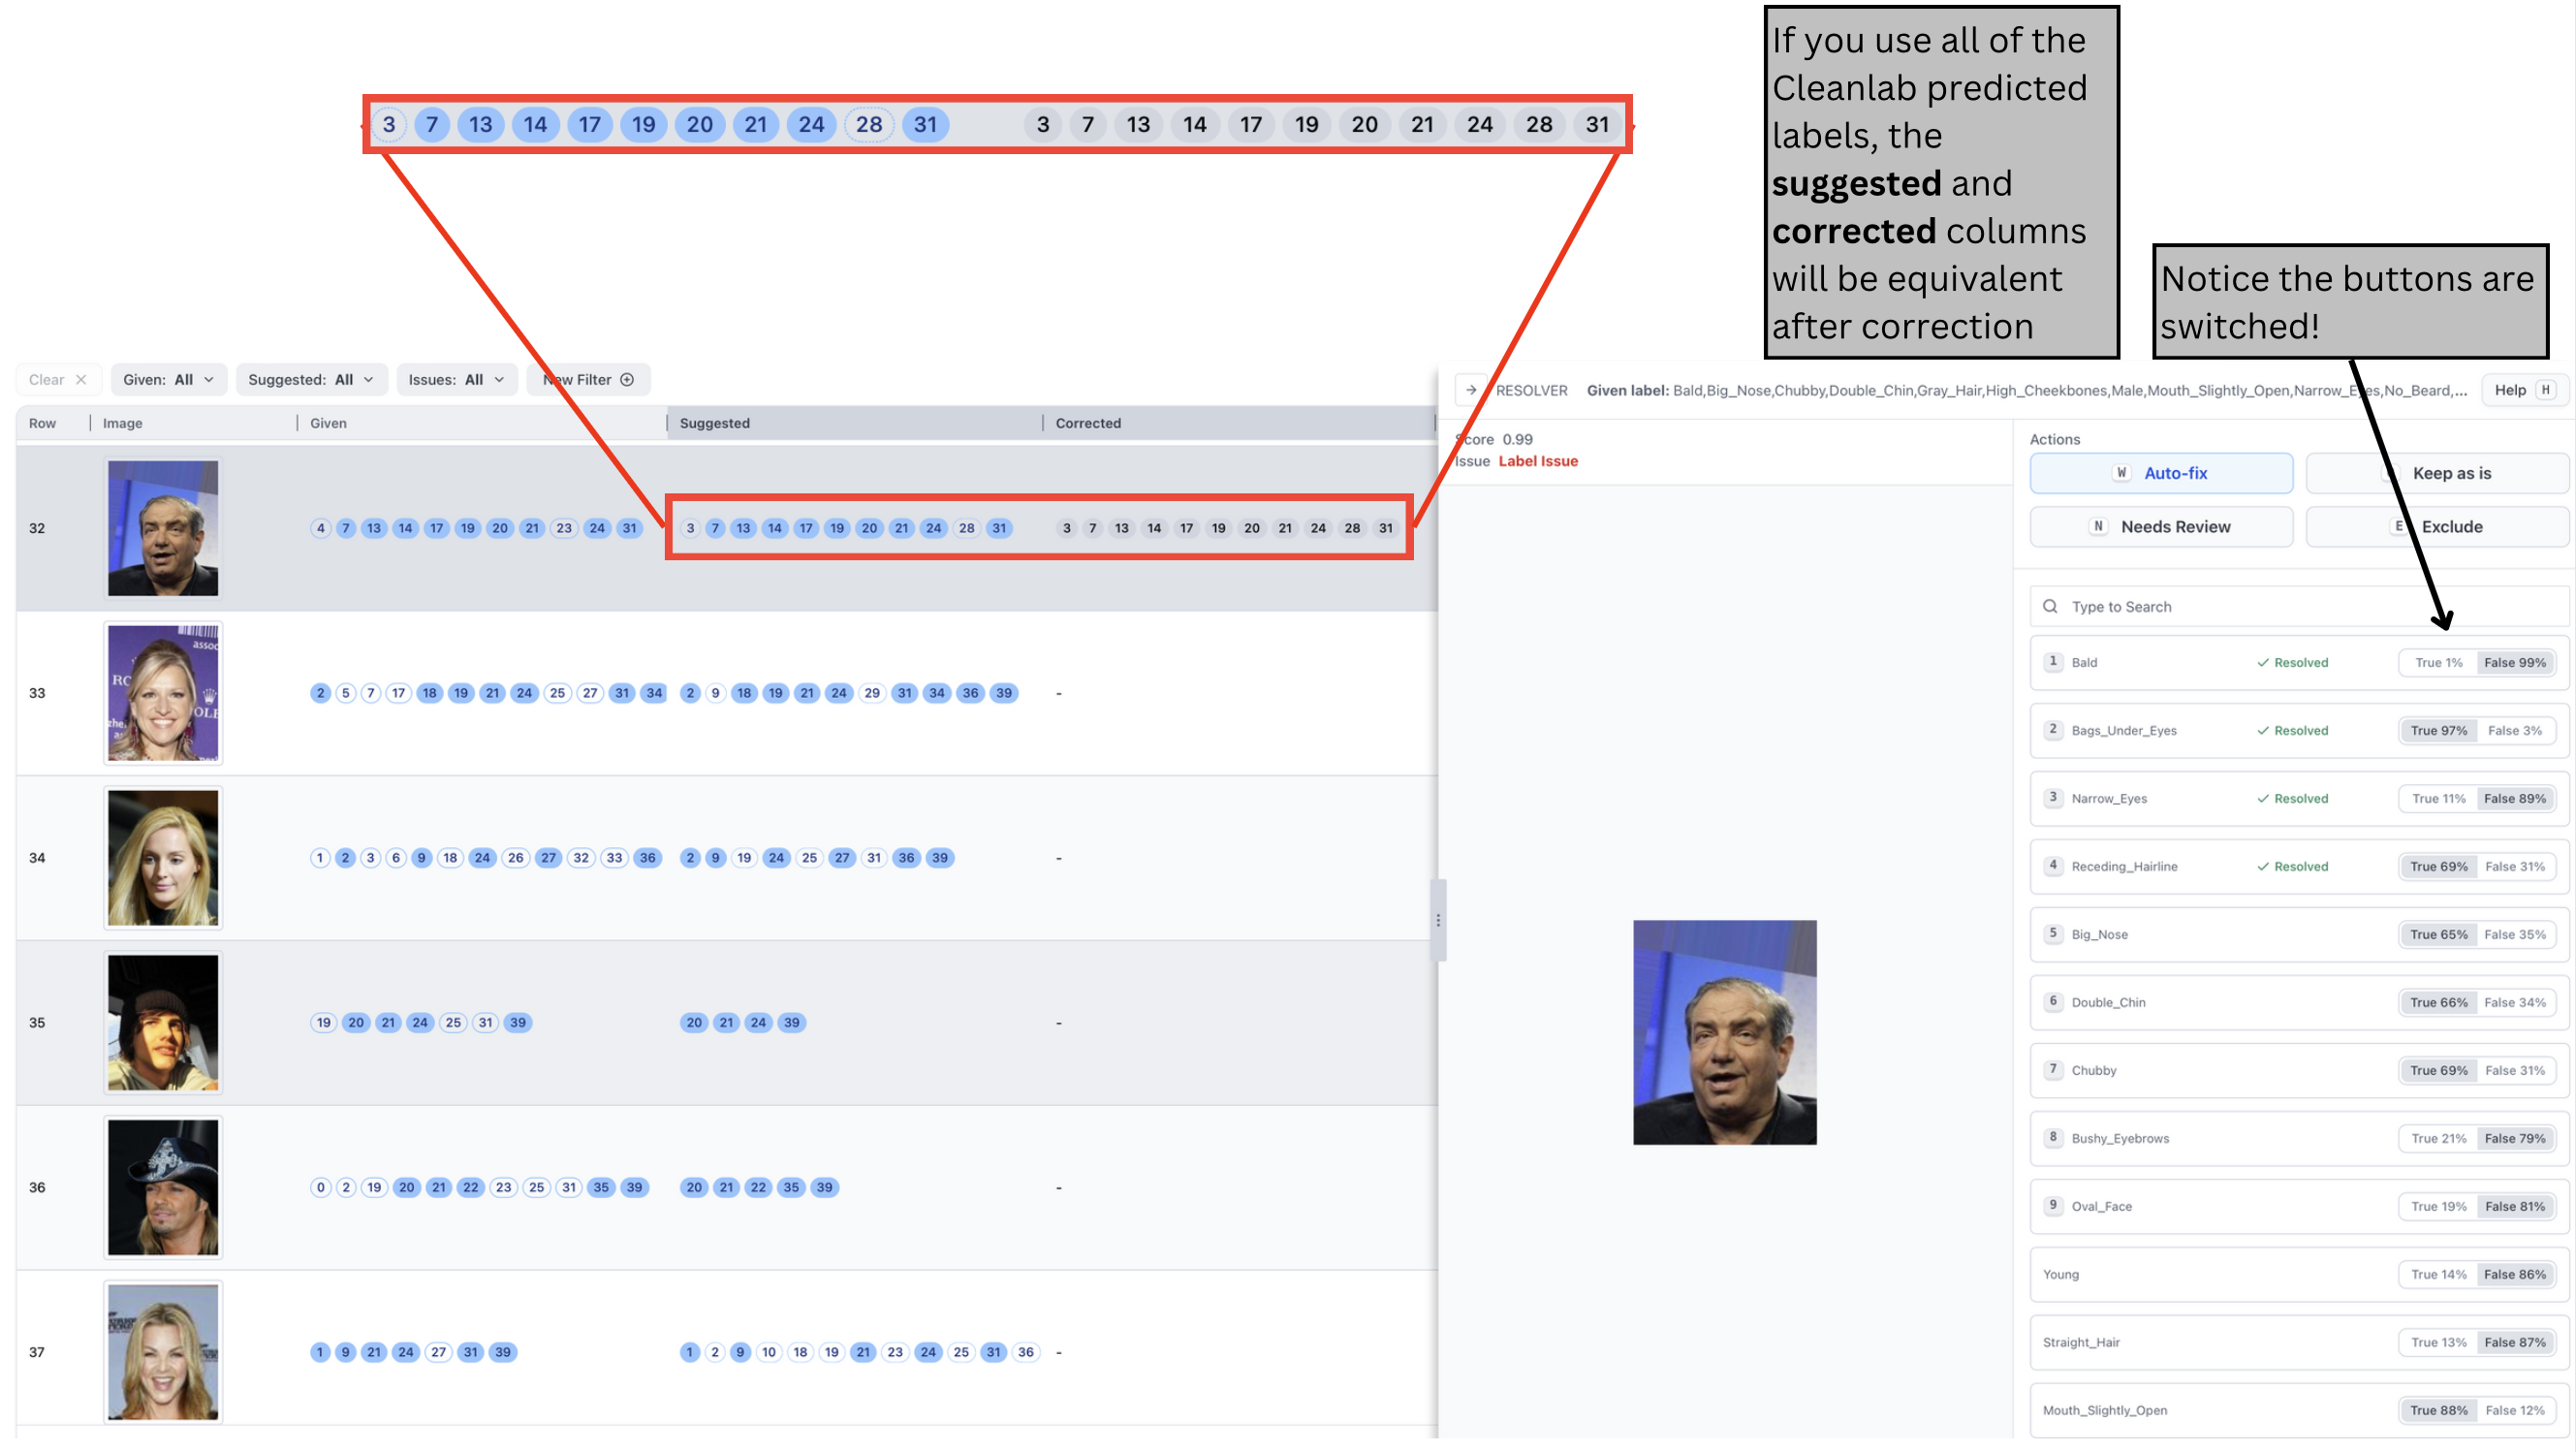
If you auto-fix a data point, the Corrected column will be filled with the values from the Suggested column. This means the labels predicted by Cleanlab for this data point will be used as the Corrected labels.
It is important to understand that the Suggested labels represent Cleanlab’s prediction for how this data point should be labeled. This list doesn’t just suggest adjustments to the given labels; it’s the complete list of predicted classes that apply to this data point.
For instance, if the Suggested column is empty for a data point, Cleanlab predicts that none of the classes apply to it.
Samples without any issues
The data samples that doesn’t have anything in the Issues column are free of issues. For these data samples, the Suggested and Given labels are the same, and highlighted in blue.
Speeding Up Data Correction
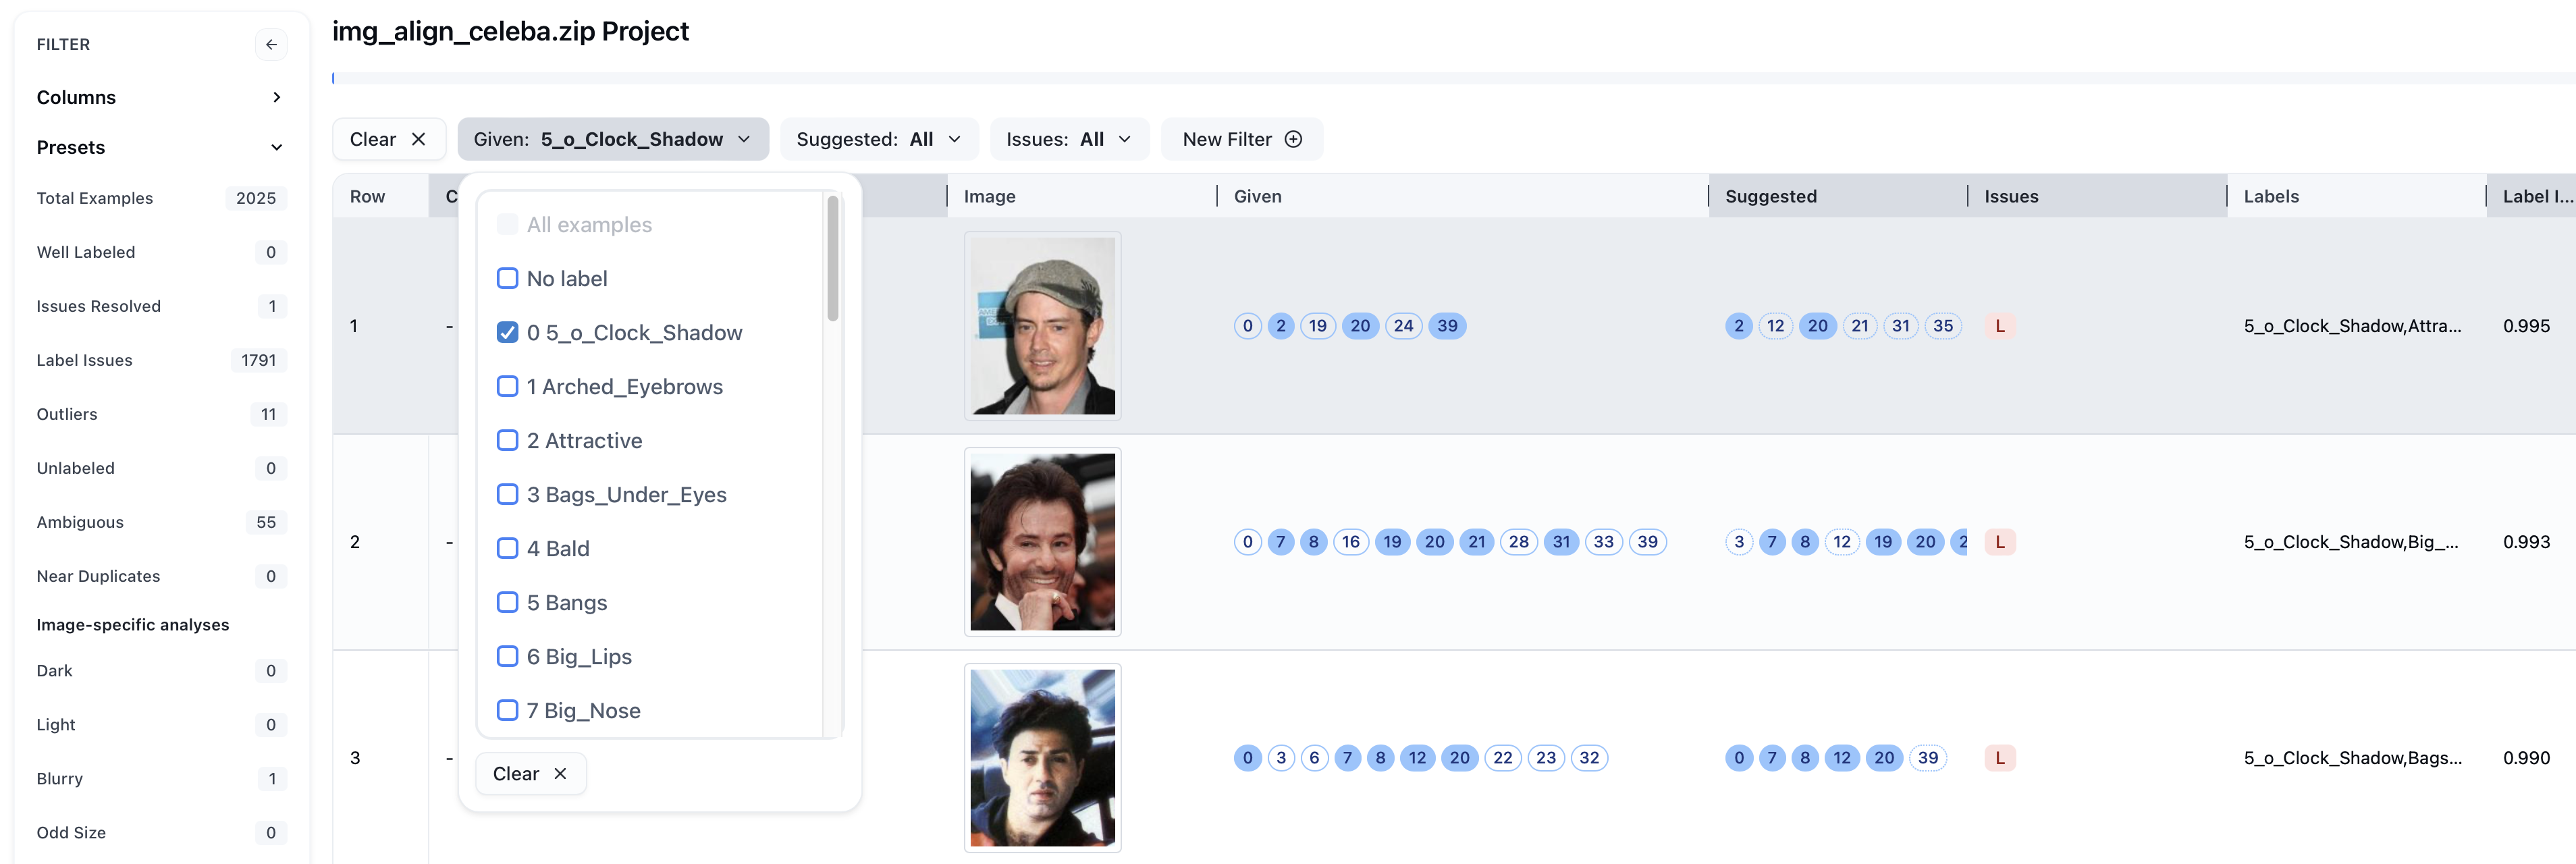
Filtering
Just like in multi-class projects, you can use the filter bar to sort through your data for specific kinds of issues. This speeds up the quality improvement process by focusing your attention to specific subsets of data. For example, let’s select images that are marked as an issue (Issues: Label Issue) and contain 5_o_Clock_Shadow.
Auto-Fix
To speed up your cleaning even further, you have the option to automatically apply the Cleanlab-predicted set of labels to a single image or many images at a time.
For a single image, just click the yellow Auto-fix icon. After verifying the accuracy of the Cleanlab suggested label set, this is the quickest way to make the correction instead of toggling each of the labels one-by-one.
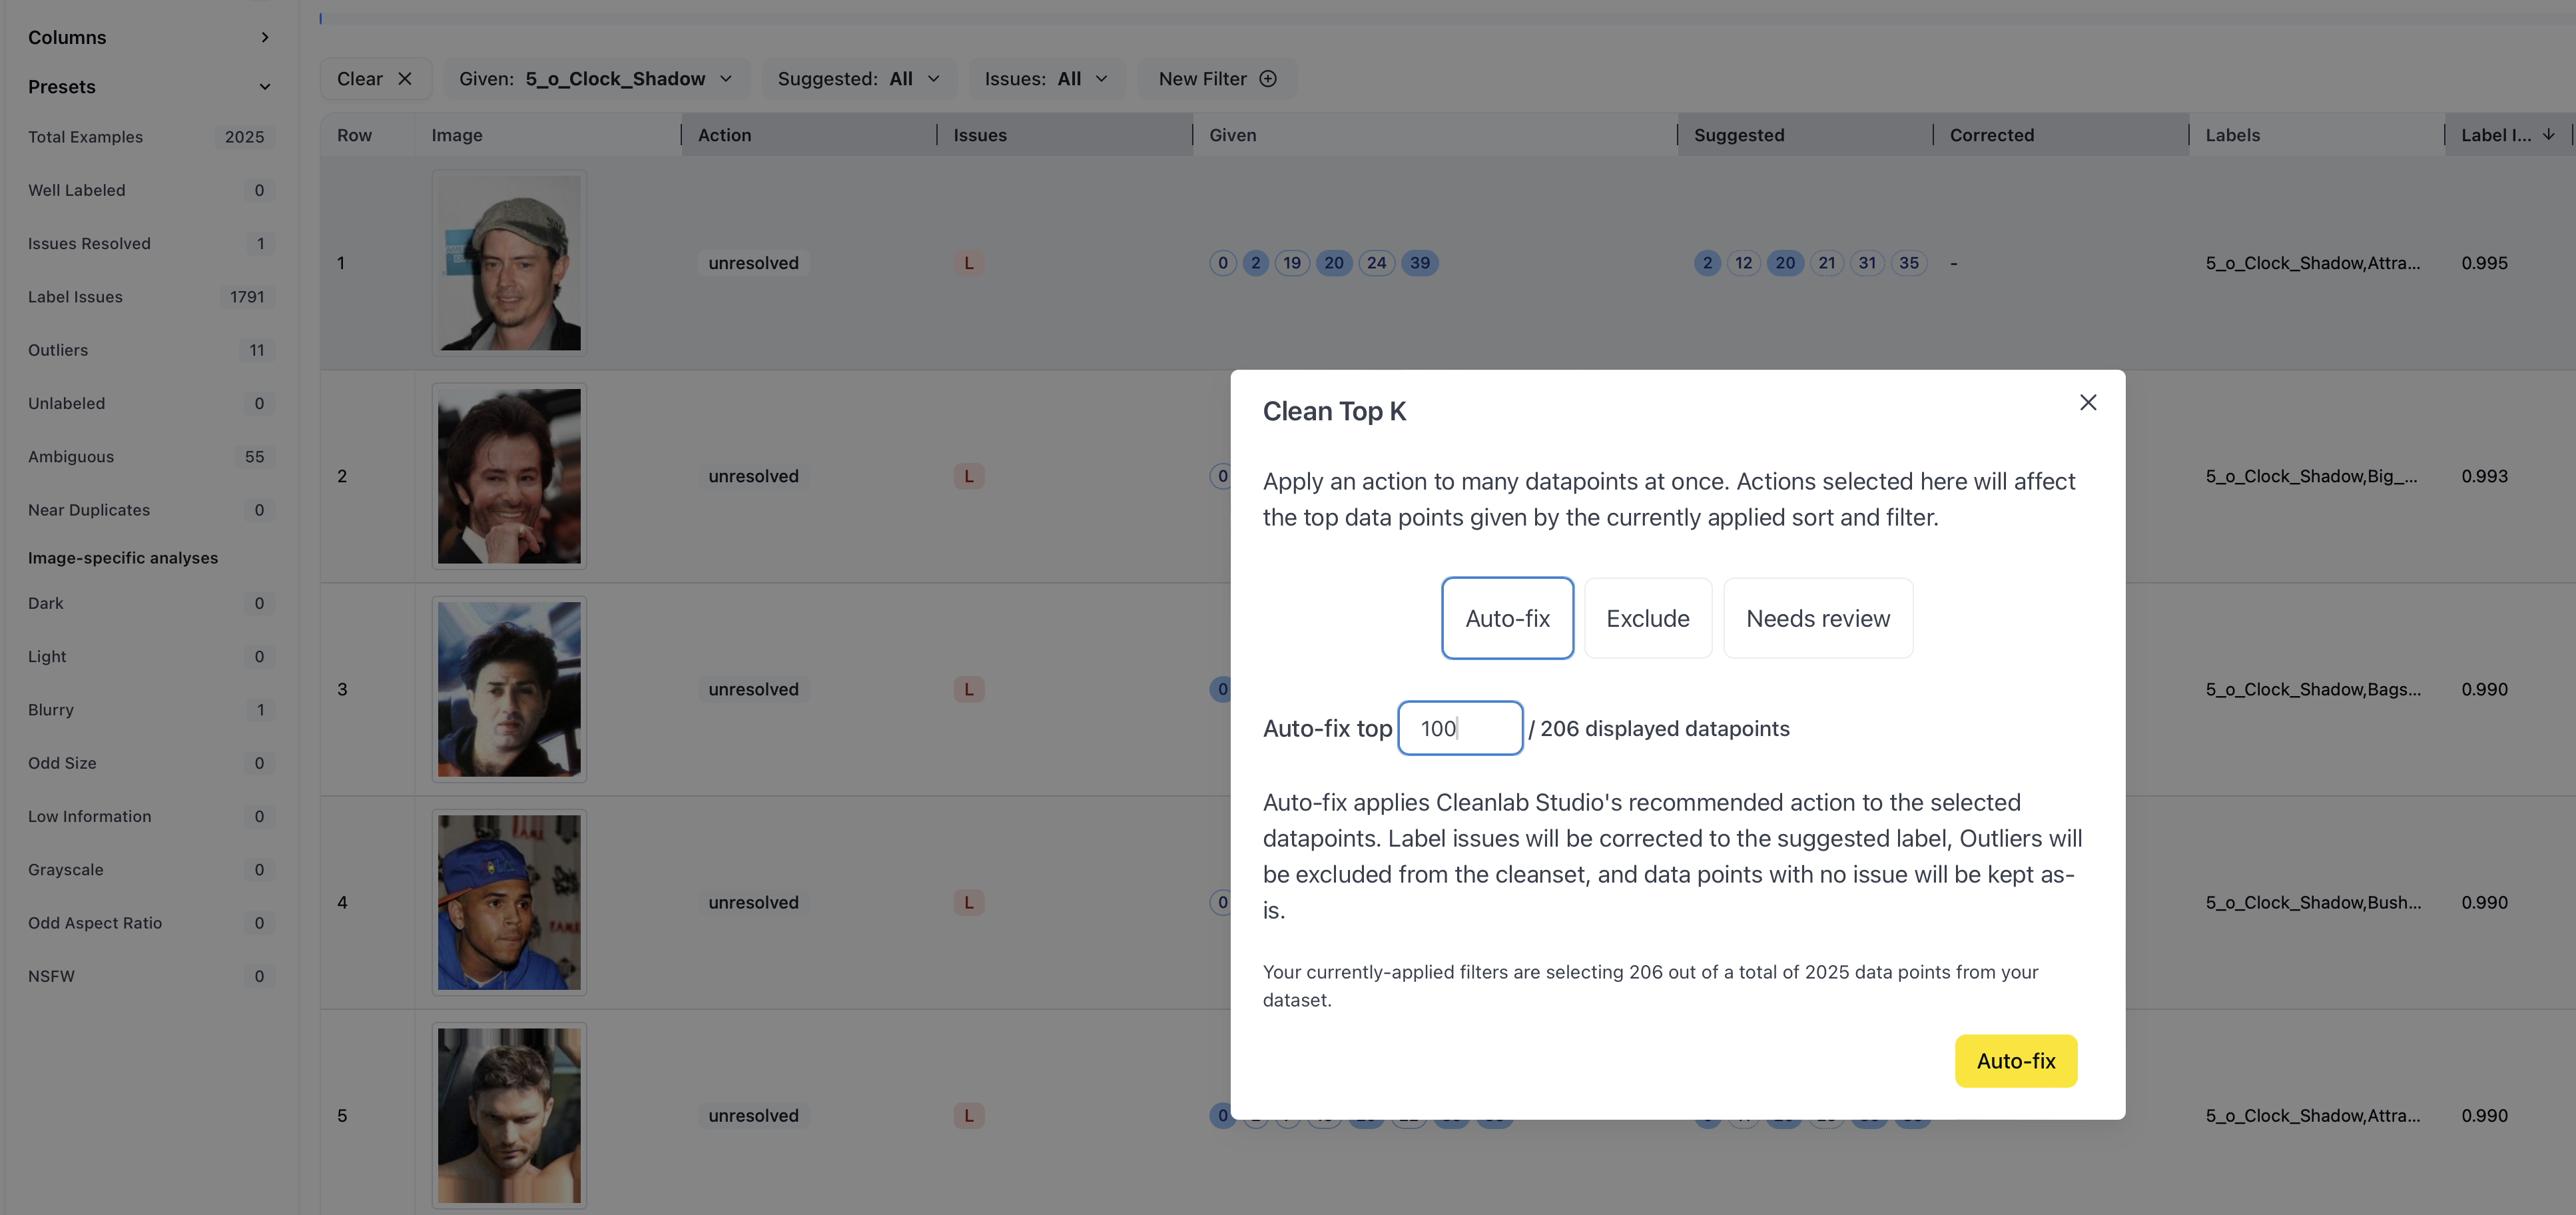
For multiple images, you can use the Clean Top K feature. Select the icon at the bottom and select Auto-fix, as shown above. Then, enter how many data points you want automatically corrected to the Cleanlab-suggested set of labels. Note that this will not override your manual corrections.
Auto-fixing multiple images at once is much faster than individual correction, but it might not be as accurate. You should use your knowledge of the data combined with the analytics and filters to determine the balance of manual and automatic corrections necessary.
Export your improved data!
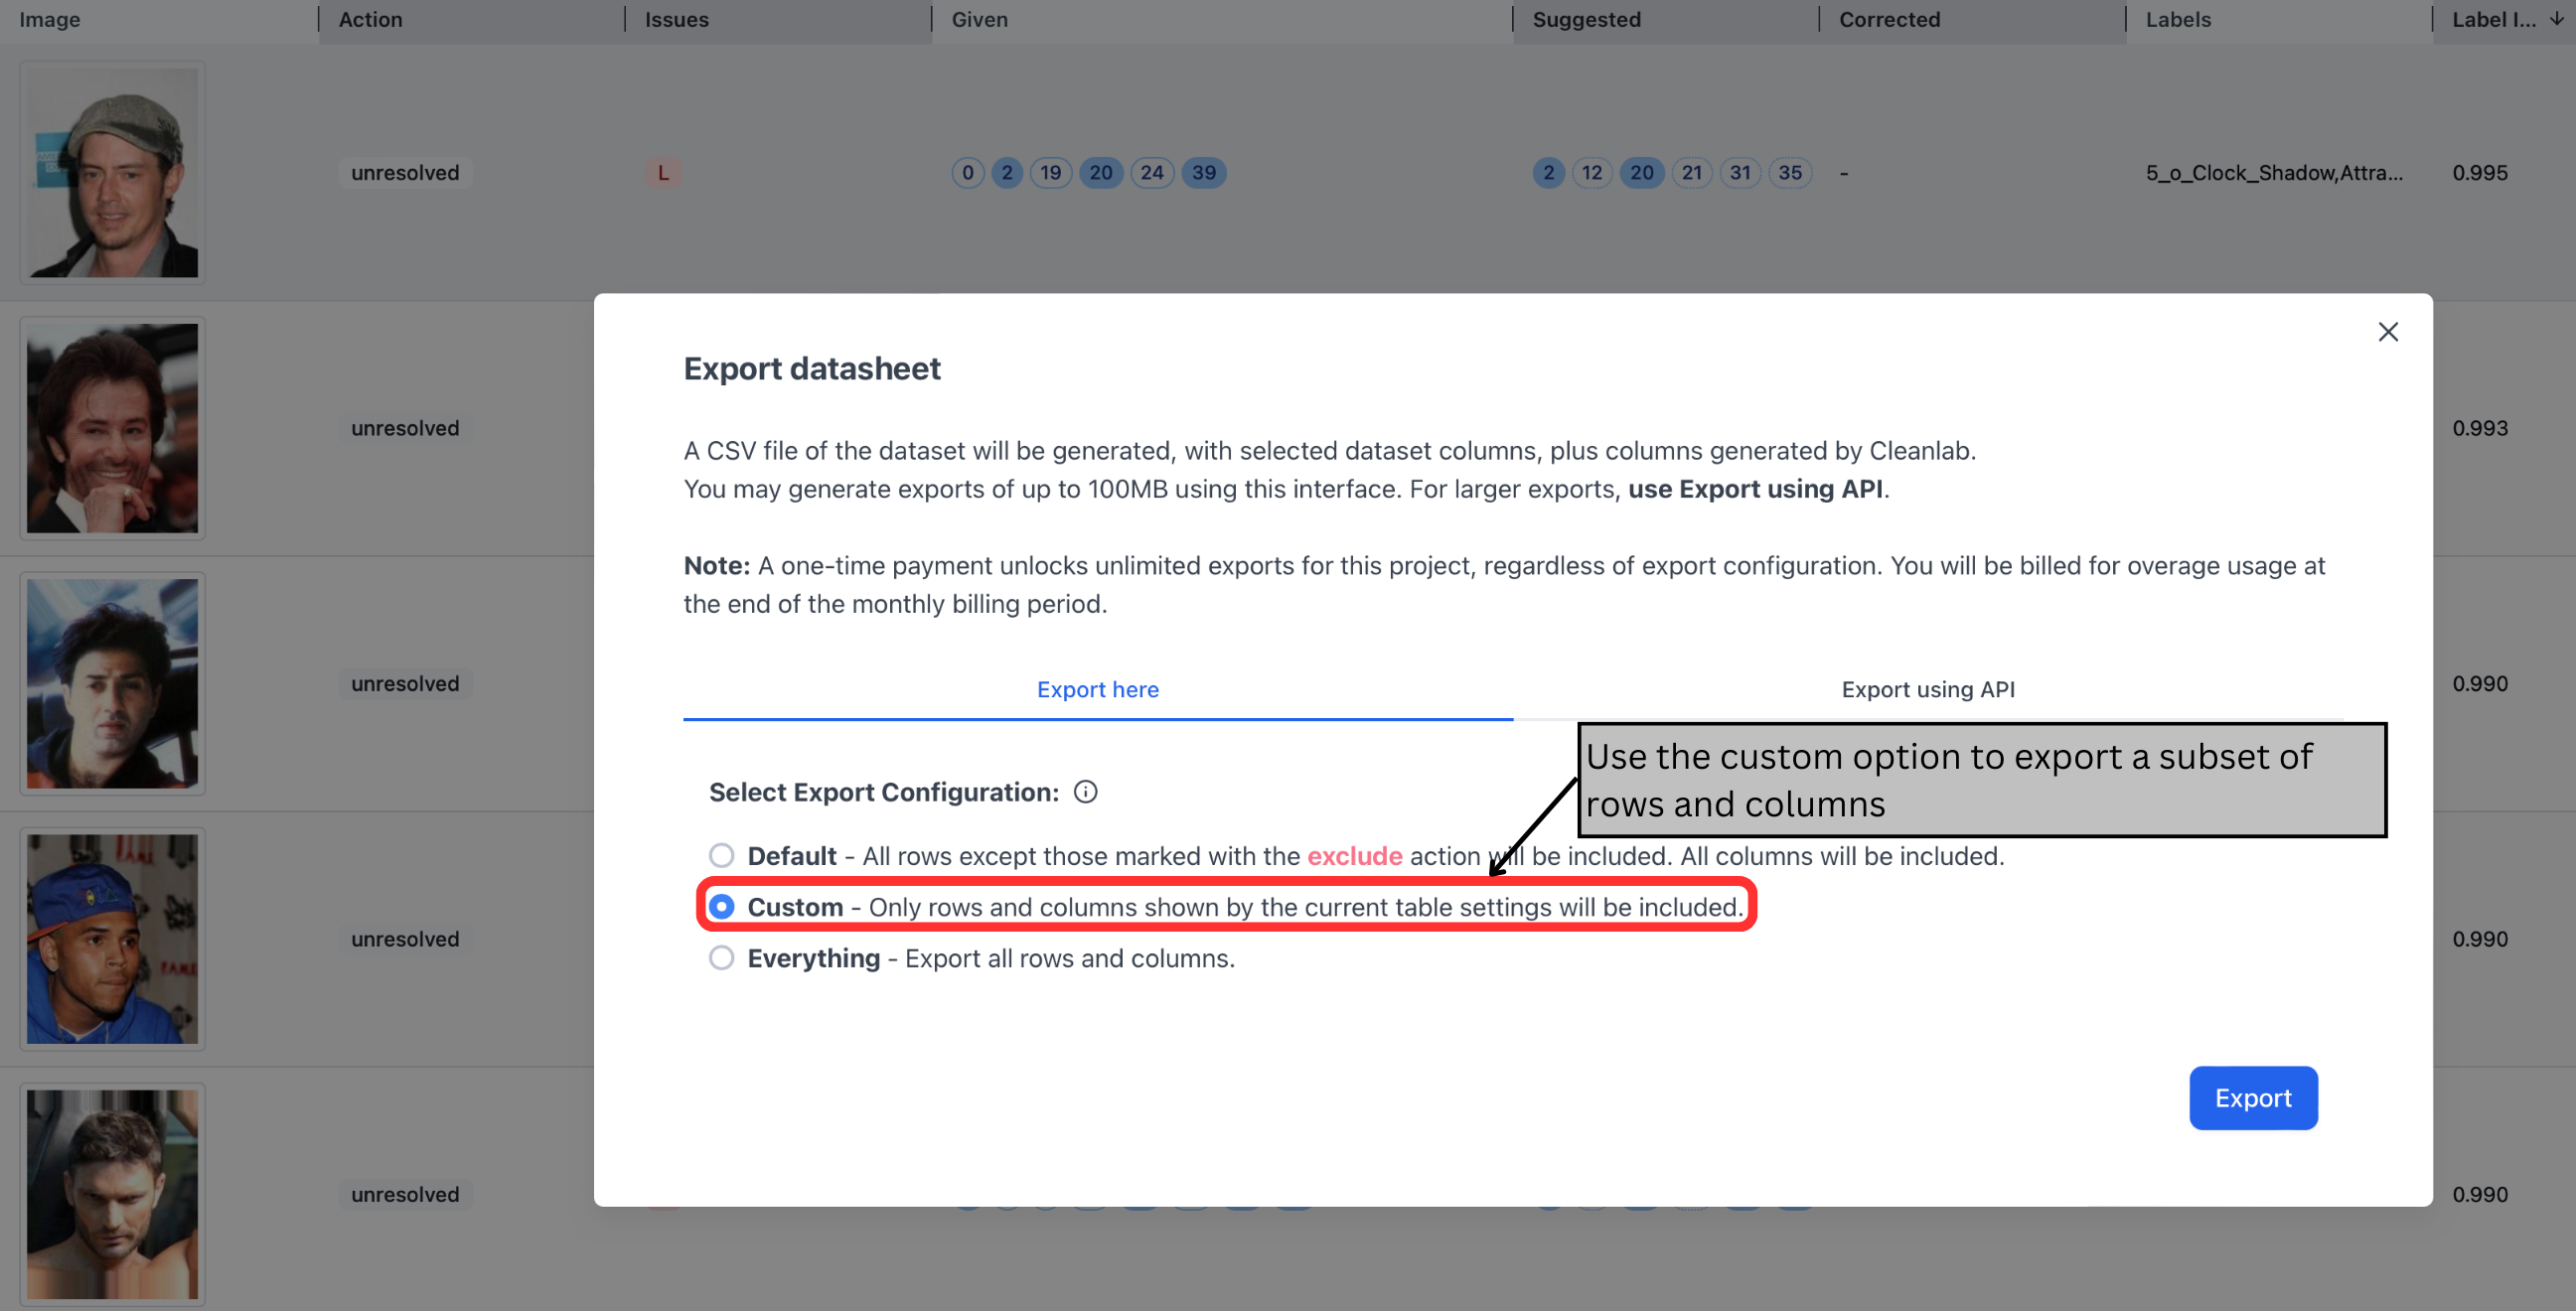
Once you are happy with your project, you can export it to use your improved data in downstream applications like modeling and analytics. You can choose from:
- Default: All rows except those marked with the
excludeaction will be included. All columns will be included. - Custom: Only rows and columns shown by the current table settings will be included.
- Everything: Export all rows and columns.
For example, if you’d like to export the subset of data you filtered above (marked as an issue, contains 5_o_Clock_Shadow) you would select Custom.
Utilizing Your New Data
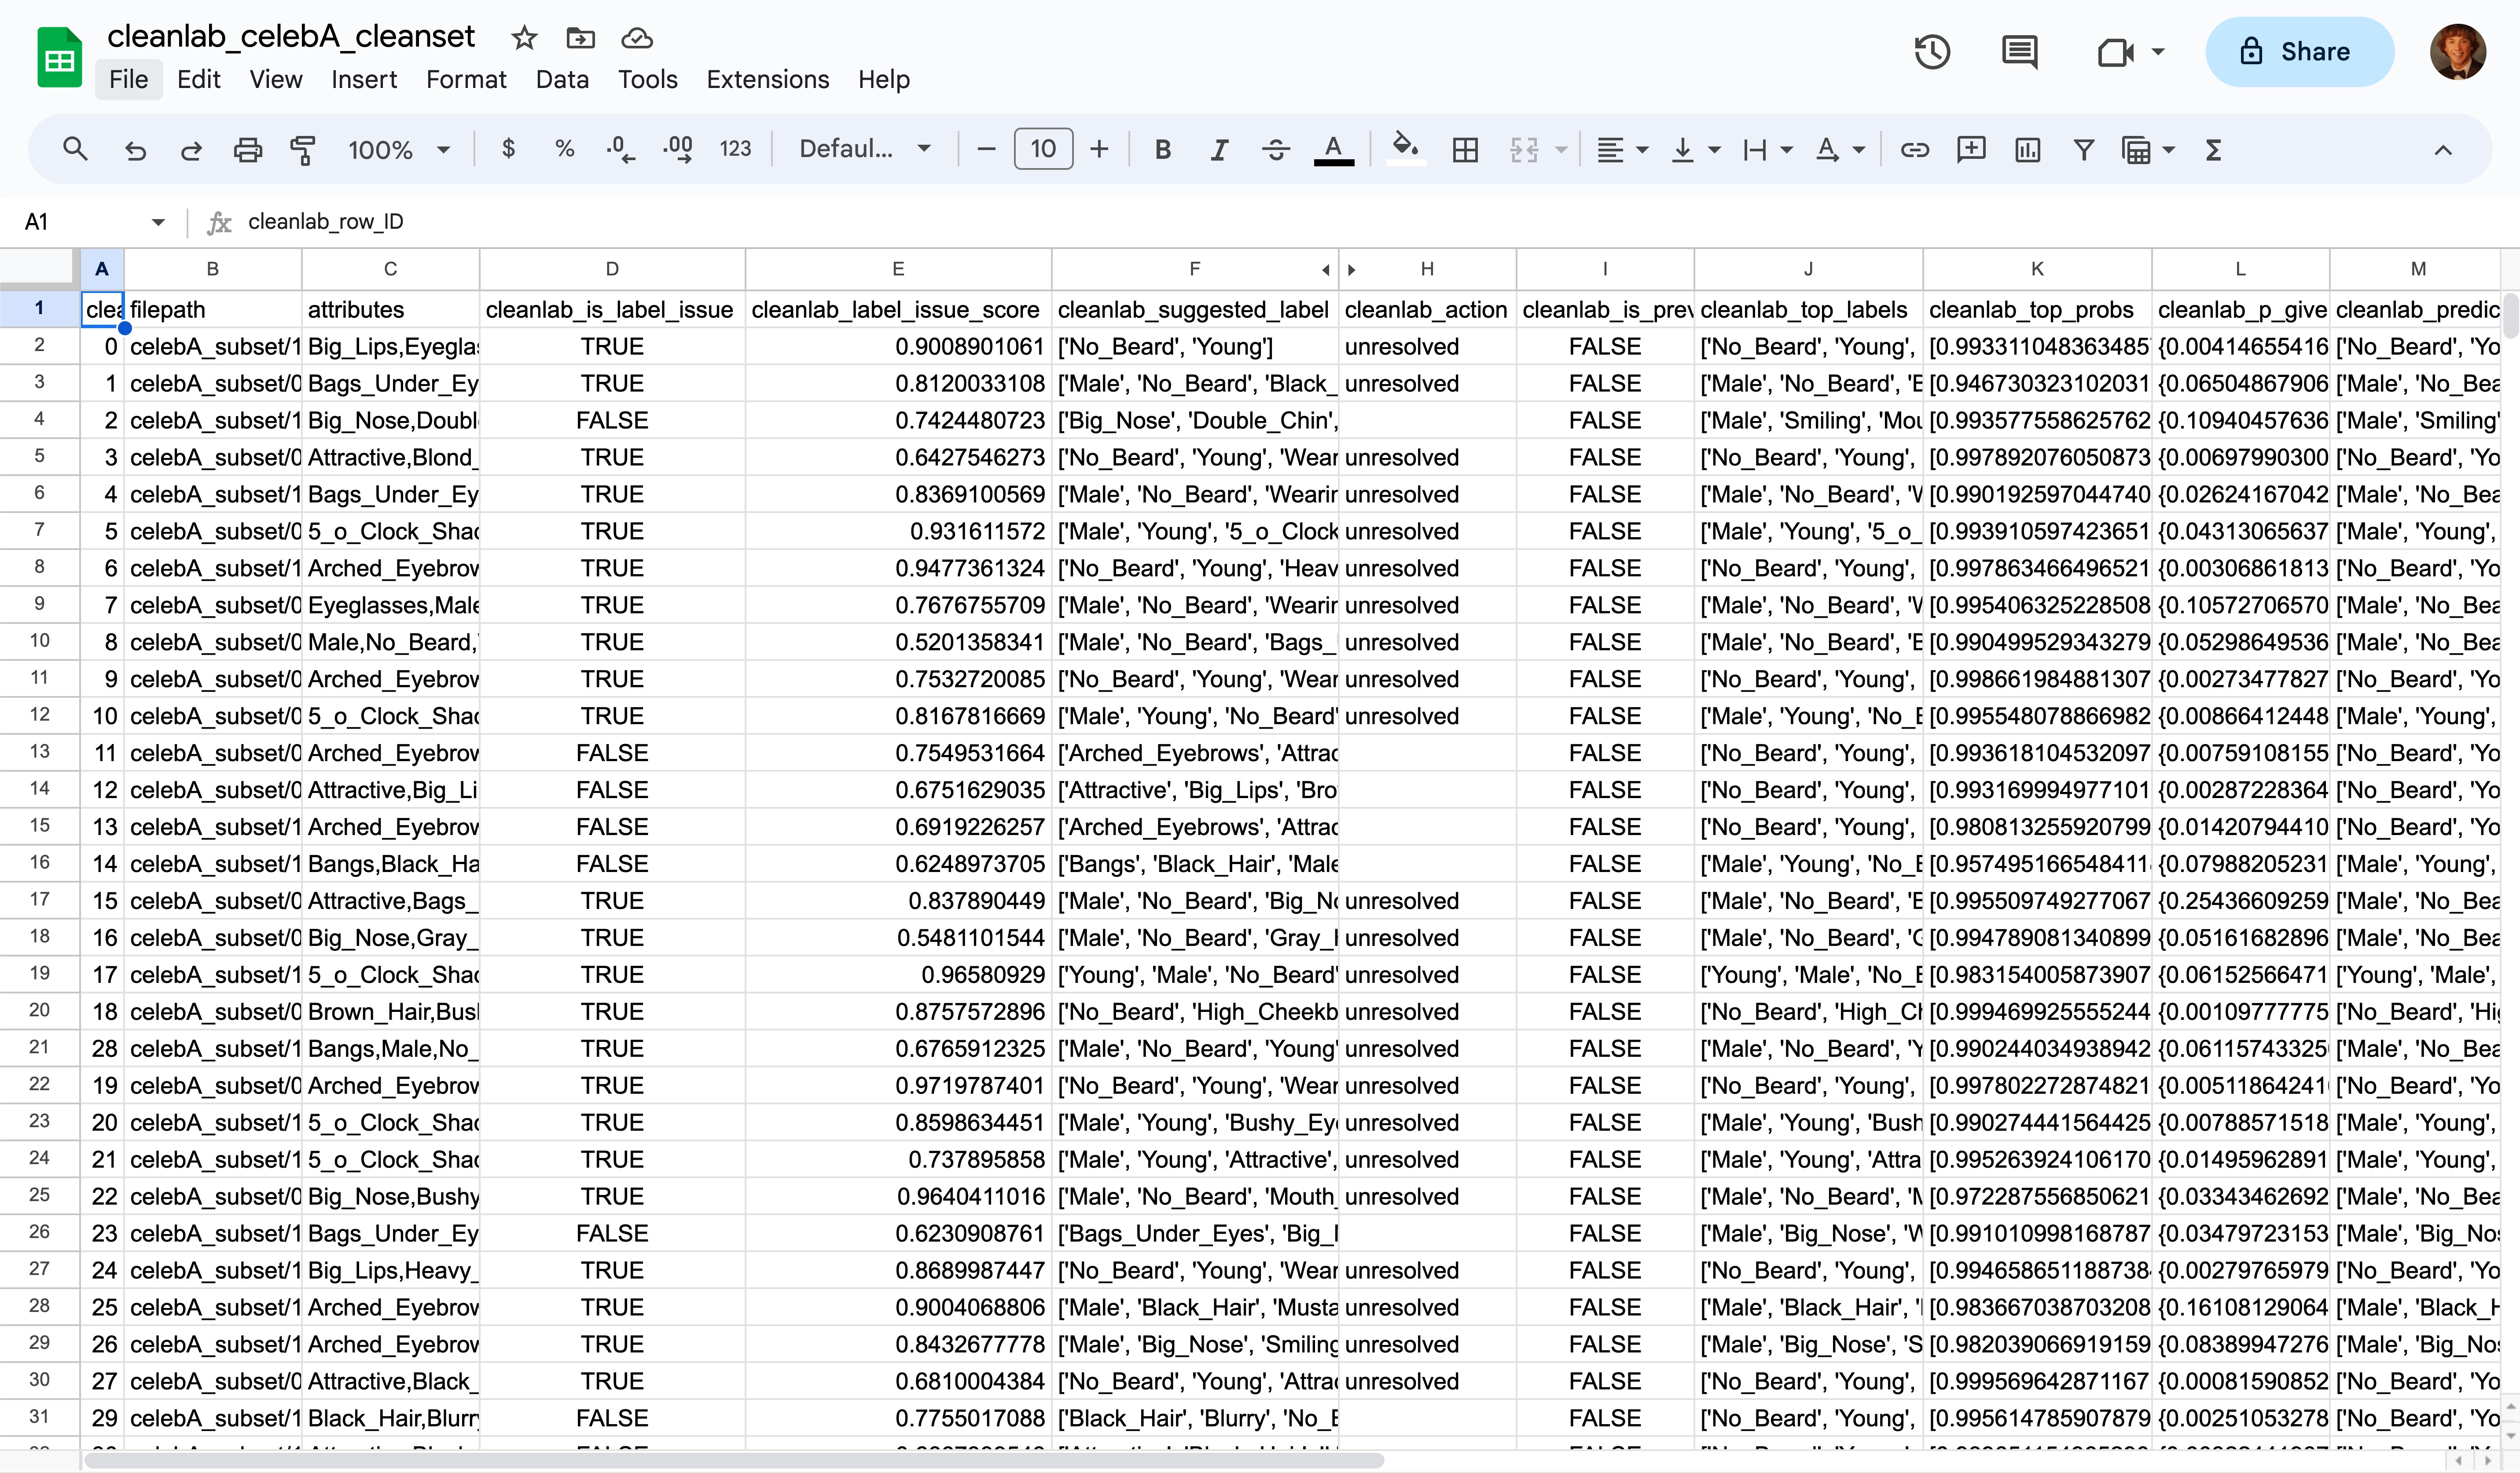
Here’s the exported cleanset in Google Sheets with all of the added Cleanlab columns. You can use the corrected multi-label dataset in place of your original dataset to produce more reliable machine learning and analytics without any change in your existing pipelines/code.
With just a few clicks, you can also deploy the cutting-edge ML that Cleanlab Studio originally used to audit your dataset to predict the tags of new data with high accuracy, directly in the web interface or via Python API. Check out more details here.
Appendix
Breaking down the formula: =ARRAYFORMULA(TEXTJOIN(",", TRUE, IF(C2:AP2=1, $C$1:$AP$1, "")))}}
ARRAYFORMULA(function):
- This function allows you to apply a function or formula over a range (an array) rather than a single cell. However, in this specific formula, it’s not being fully utilized to process multiple rows at once, but rather to ensure that the inner functions handle arrays properly.
TEXTJOIN(delimiter, ignore_empty, array1, …):
- This function joins multiple values (from arrays or ranges) into one string.
delimiter: Specifies the character or string to insert between each text item in the resulting string. Here, we’re using",", which means we want to separate the values with a comma (with no space in between).ignore_empty: IfTRUE, the function will skip any empty values or arrays. This ensures that we don’t have unnecessary commas in the result.array1, ...: The arrays or ranges to join. In this formula, the array is produced by theIFfunction.
IF(test, value_if_true, value_if_false):
- This function returns one value if a logical test is
TRUEand another value if it’sFALSE. test: The logical test we’re checking. In this case, we’re testing if each cell in the rangeC2:AP2equals 1.value_if_true: The value to return if the test is true. Here, we’re returning the corresponding header from the range$C$1:$AP$1.value_if_false: The value to return if the test is false. We’re returning an empty string (""), meaning if the cell doesn’t contain a 1, it doesn’t contribute to the final output.
- This function returns one value if a logical test is
So, in simpler terms, here’s how the formula operates:
- For each cell in
C2:AP2, it checks if the value is 1. - If the value is 1, it captures the corresponding header from
C1:AP1. - It then takes all the captured headers and joins them into a single string, separated by a comma.
- The result is a comma-separated list of headers where the values in
C2:AP2are 1.
For instance, if C2 has a value of 1 and its corresponding header in C1 is “Male”, and if D2 doesn’t have a value of 1, but E2 does and its header in E1 is “Tall”, the formula’s output for row 2 will be “Male,Tall”.