Cleanlab Analytics
Cleanlab Analytics provides a real-time dashboard for you to monitor the health of your AI app, the impact of the Cleanlab AI Platform in preventing bad responses, and the engagement of your SMEs in improving your AI app’s performance in Cleanlab.
Cleanlab Analytics seamlessly integrates with Cleanlab AI Platform’s real-time evaluations, allowing you to answer questions such as:
- How many bad responses did my bot serve to users this week?
- In what countries are users getting the worst responses?
- What are the reasons for why my app is giving bad responses (underlying search? ungrounded/made-up responses)?
- How many bad responses were prevented entirely by Cleanlab?
Who’s it for?
- Product Owners and Stakeholders tracking the health of their AI app, volume of bad responses being served to users, and Cleanlab’s remediation impact over time
- Developers to understand at a high-level the performance of their app, and serve as their entry point to drill into specific examples of failures
- SMEs to observe the overall app performance and trends
- SME Managers & Team Leads to track SME contributions
What do Cleanlab Analytics report?
| Metric | Capability |
|---|---|
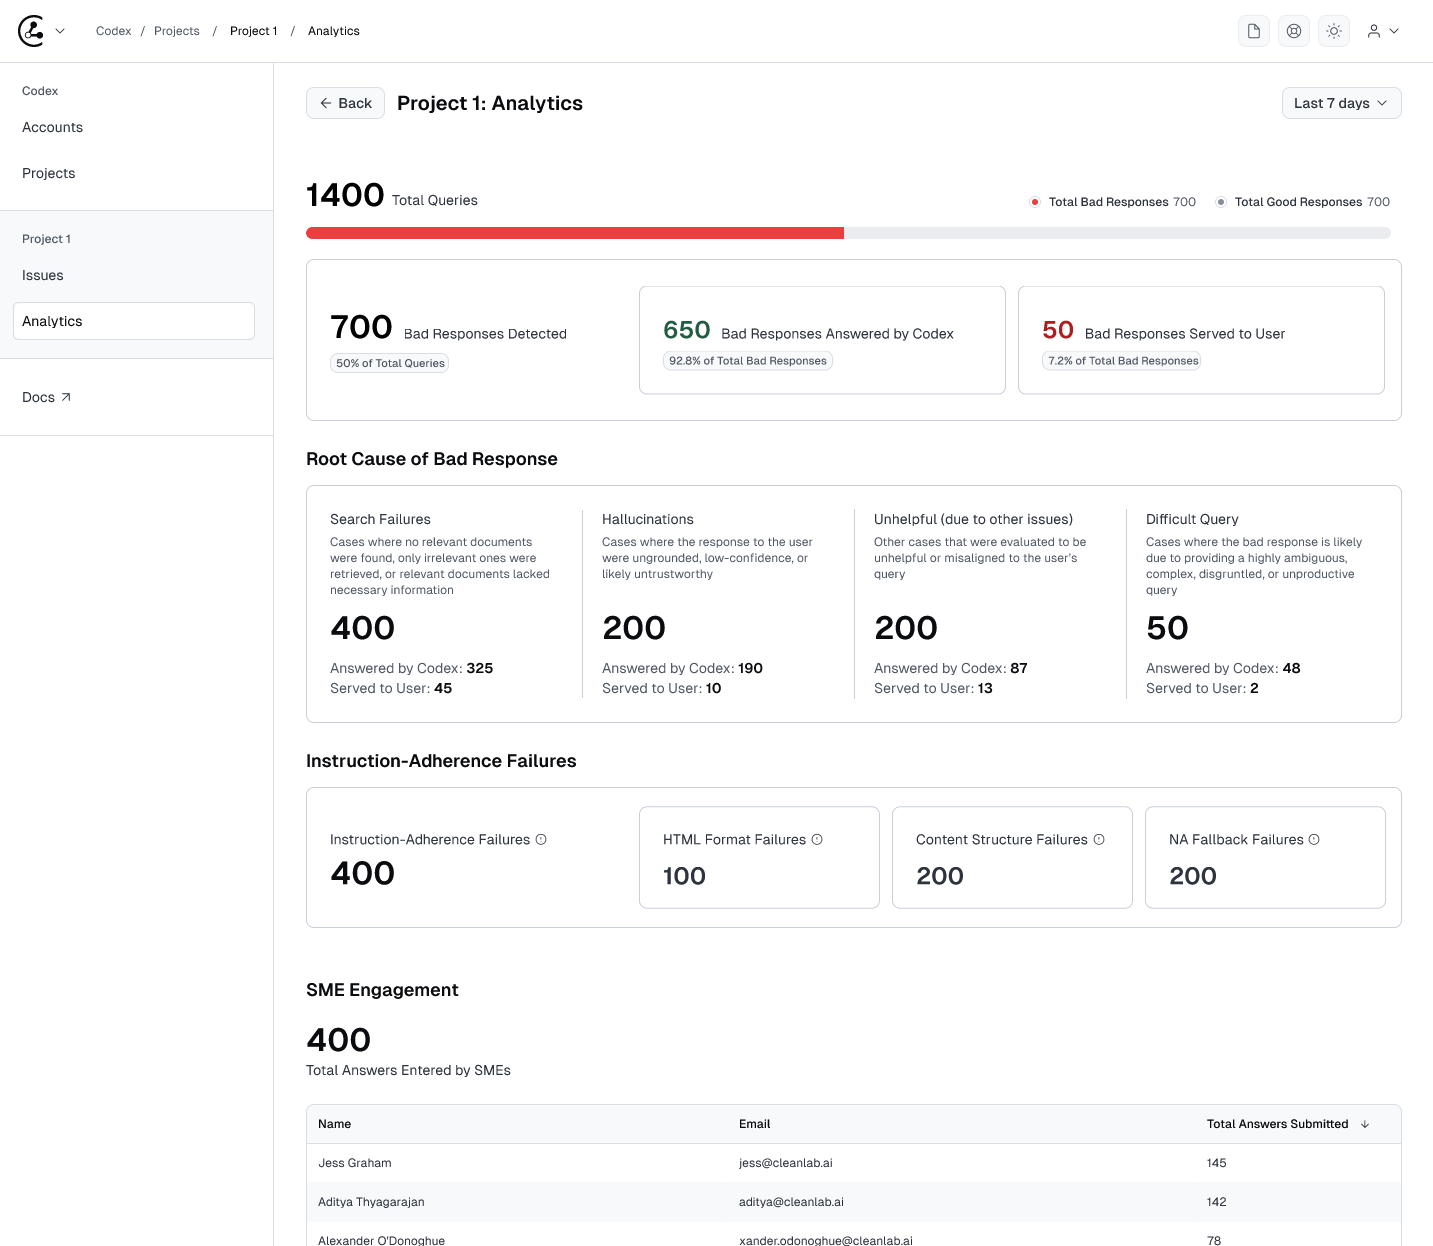
| Total queries | See the total volume of queries observed by Cleanlab |
| # of Good/Bad Responses Detected | See the overall health of your RAG app, based on the good/bad responses detected by Cleanlab’s real-time evaluations |
| # of Bad Responses Prevented | Of the bad responses detected by Cleanlab, you can clearly see the remediation impact of Cleanlab by the # of bad responses answered by Cleanlab. This number should increasingly grow as Cleanlab becomes more capable of remediating your AI application’s bad responses. |
| # of Bad Responses Served to Users | Of the bad responses detected by Cleanlab, this is the remainder that were not answered by Cleanlab. This number should decrease as Cleanlab becomes more capable of remediating your application’s bad responses |
| Primary RAG Issues | For your RAG application’s bad responses, we root-cause the primary issue and show you the number of failures attributed to: • Search Failures • Hallucinations • Unhelpful Responses • Difficult Queries |
| Instruction-Adherence Failures | Measure the health of your AI app in adhering to each individual system instruction |
| SME Engagement | Measure the engagement from each SME, based on the number of answers they’ve provided in Cleanlab |
How do I measure the impact of Cleanlab improving my application?
One of the key metrics in Cleanlab is the # of Bad Responses Prevented By Codex, highlighted in green within your Cleanlab Analytics dashboard. This metric tracks the number of times where an Answer entered by an SME in Cleanlab, was provided back to the user in place of an other-wise bad response.
As you continue to add more Answers within Cleanlab, and those Answers are served in real-time traffic, this count should increase over time, signalling a key part of the ROI and impact of Cleanlab.
How are the Primary Issues metrics defined?
The Primary Issues section in Cleanlab Analytics shows the count of issues, labeled based on the evaluations from the TrustworthyRAG module from Cleanlab.
The hierarchy of Primary Issues assigned to any Bad Response is as follows, and included in Analytics:
| Eval | Primary Issue Label |
|---|---|
| 1. If the query_ease eval score is below threshold | Difficult query |
| 2. If helpfulness eval score is below threshold | Unhelpful (Other Issues) |
| 3. If context_sufficiency eval score is below threshold | Search Failure |
| 4. Finally, if either trustworthiness or groundedness eval scores are below threshold | Hallucination |
What are the instruction-adherence metrics in Analytics?
At a glance, Cleanlab allows you to evaluate the health of your app in following the instructions you’ve provided.
Instruction-Adherence evaluations from Cleanlab measure for every AI app response, whether it complies with each individual instruction in your system prompt.
In Analytics, there will be a section that captures:
- The total number of instruction-adherence failures detected by Cleanlab
- For each individual instruction, the number of instruction-adherence failures detected by Cleanlab
What can I filter by?
Date Filters
Date Filters are available for drilling into performance in a specific period, or comparing performance over time:
- Preset Ranges: Last 7 days, 30 days, quarter, year
- Custom Range: Pick start/end dates (MM/DD/YYYY)
Other Metadata Filters
Users of Cleanlab Analytics can drill down into specific metadata categories they’re interested in, depending on what other metadata is logged into Cleanlab.
For example, if the Geo of the user is logged, Cleanlab allows you to filter down performance by region, in order to visualize in which regions Cleanlab is detecting the most bad responses from your AI application.